Container build metrics
Depot tracks detailed metrics for every container build, including duration, cache performance, resource usage, and build health. You can view metrics at both the project level and organization level.
View project-level build statistics
From your organization's projects page, click on a project to view a list of recent builds.
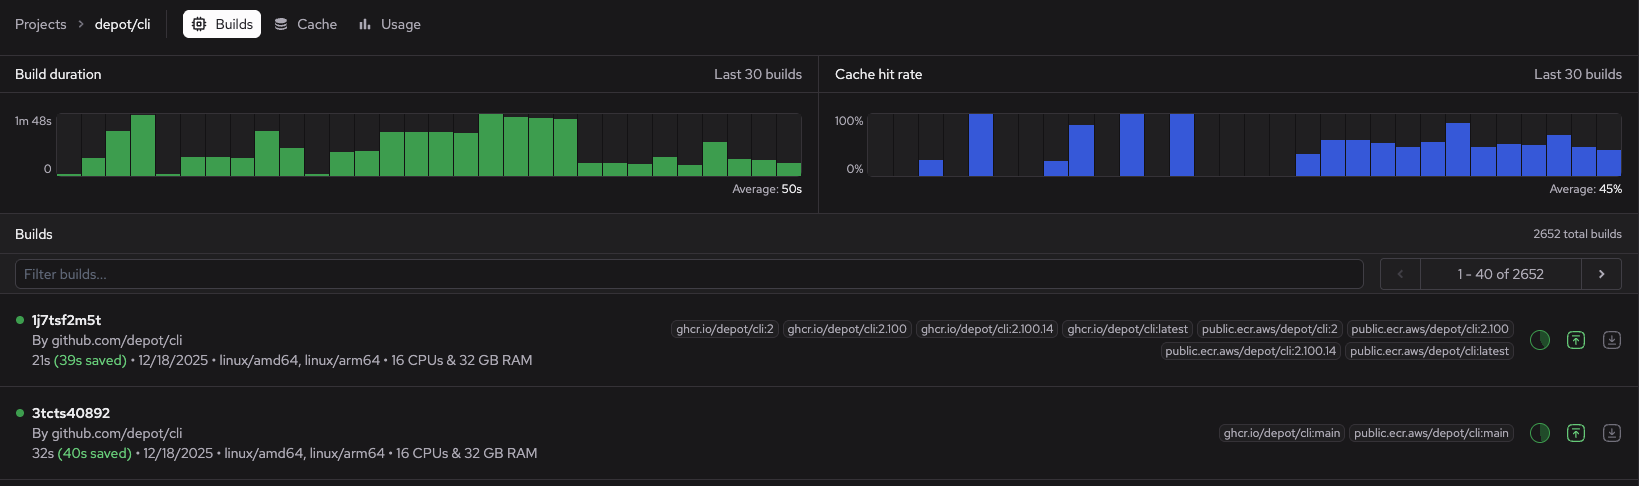
The project page displays a build duration chart and a cache hit rate chart for the last 30 builds. These charts can help you spot builds that took unusually long, sudden drops in cache performance, and build health trends.
You can see the following at a glance for each build:
- Status
- Who or what triggered the build
- Total execution time (and time saved)
- Platforms and hardware
- Image tags
- Visual indicator icons for Depot registry saves, cache hits, and push and load actions
View metrics per build
To view metrics for a specific build, go to the build details page.
-
Go to your organization's projects page.
-
Click a project.
-
Click a build.
The build details page opens to the Logs view by default.

The build details page displays the following:
- Resource utilization
- Build status
- Build steps
- Build information and metrics in the sidebar
Monitor resource utilization
The Resource Utilization graph at the top of the build details page shows if and when your build reaches CPU and memory limits. You can use it to monitor resource utilization across your build steps. Notification banners display when Depot detects out of memory (OOM) events and when utilization peaks exceed 90% of allocated CPU or memory. For example:
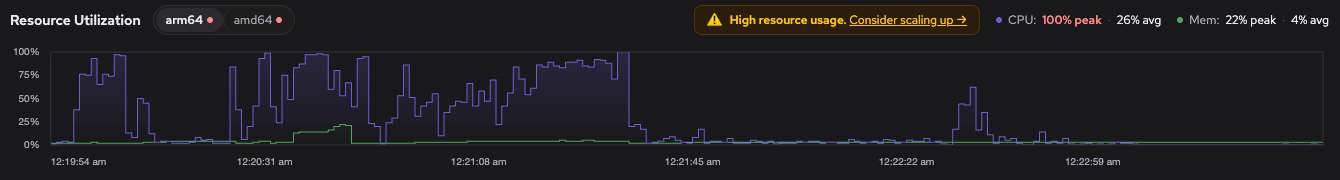
For multi-architecture builds, click the architecture selector to view graphs for each one.
View metrics and logs for each build step
Build step metrics help you identify steps that have recently slowed down, cache invalidation issues affecting specific steps, and unusual performance patterns.
To view performance metrics and details for individual build steps, click a step in the build Logs view.
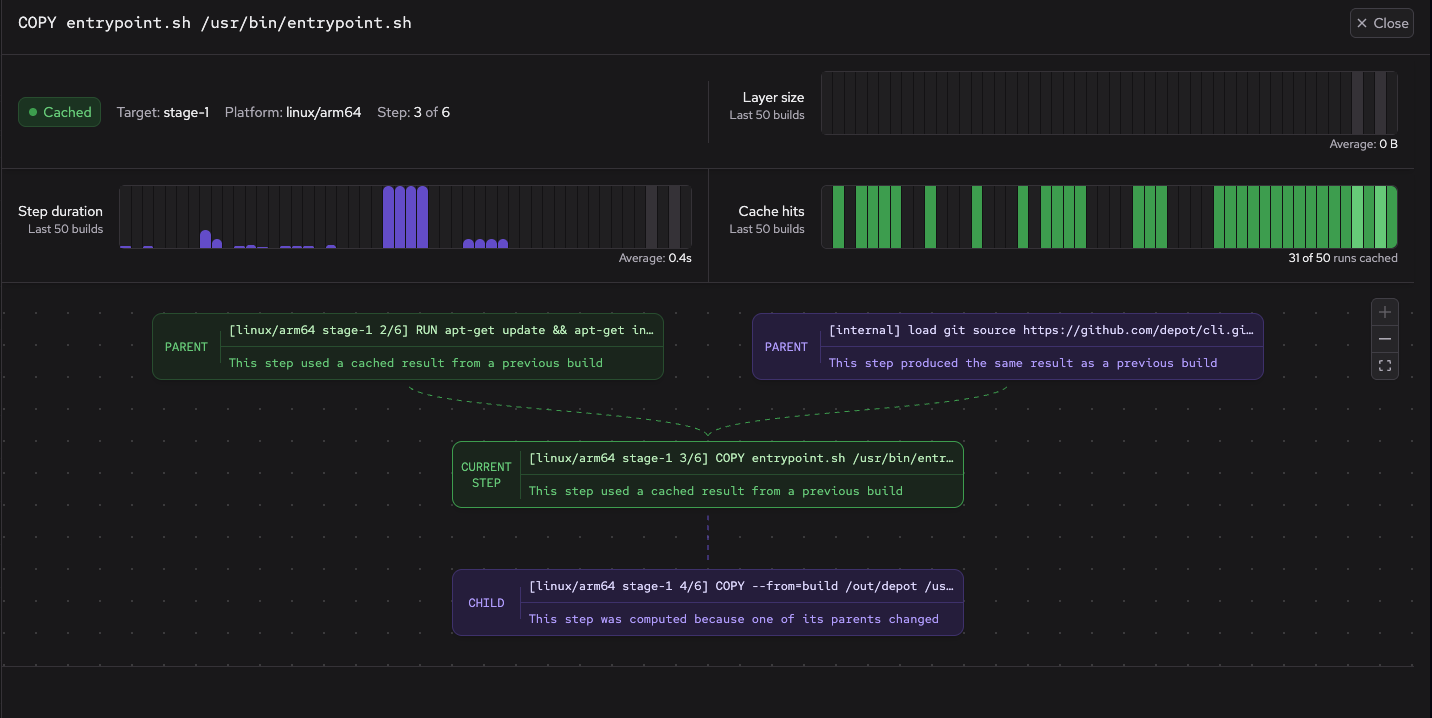
The build step panel shows the following:
- Status, duration (if not cached), target name (if applicable), platform, and step number.
- Graphs for layer size, step duration, and cache hits for the last 50 builds.
- Dependency graphic showing which steps feed into this step and what this step outputs.
- Console output (if any) generated by the step.
Track monthly project usage
To view aggregate statistics for a project over time, go to the project's Usage page.
- Go to your organization's projects page.
- Click a project.
- Click the Usage tab.
- Select a month.
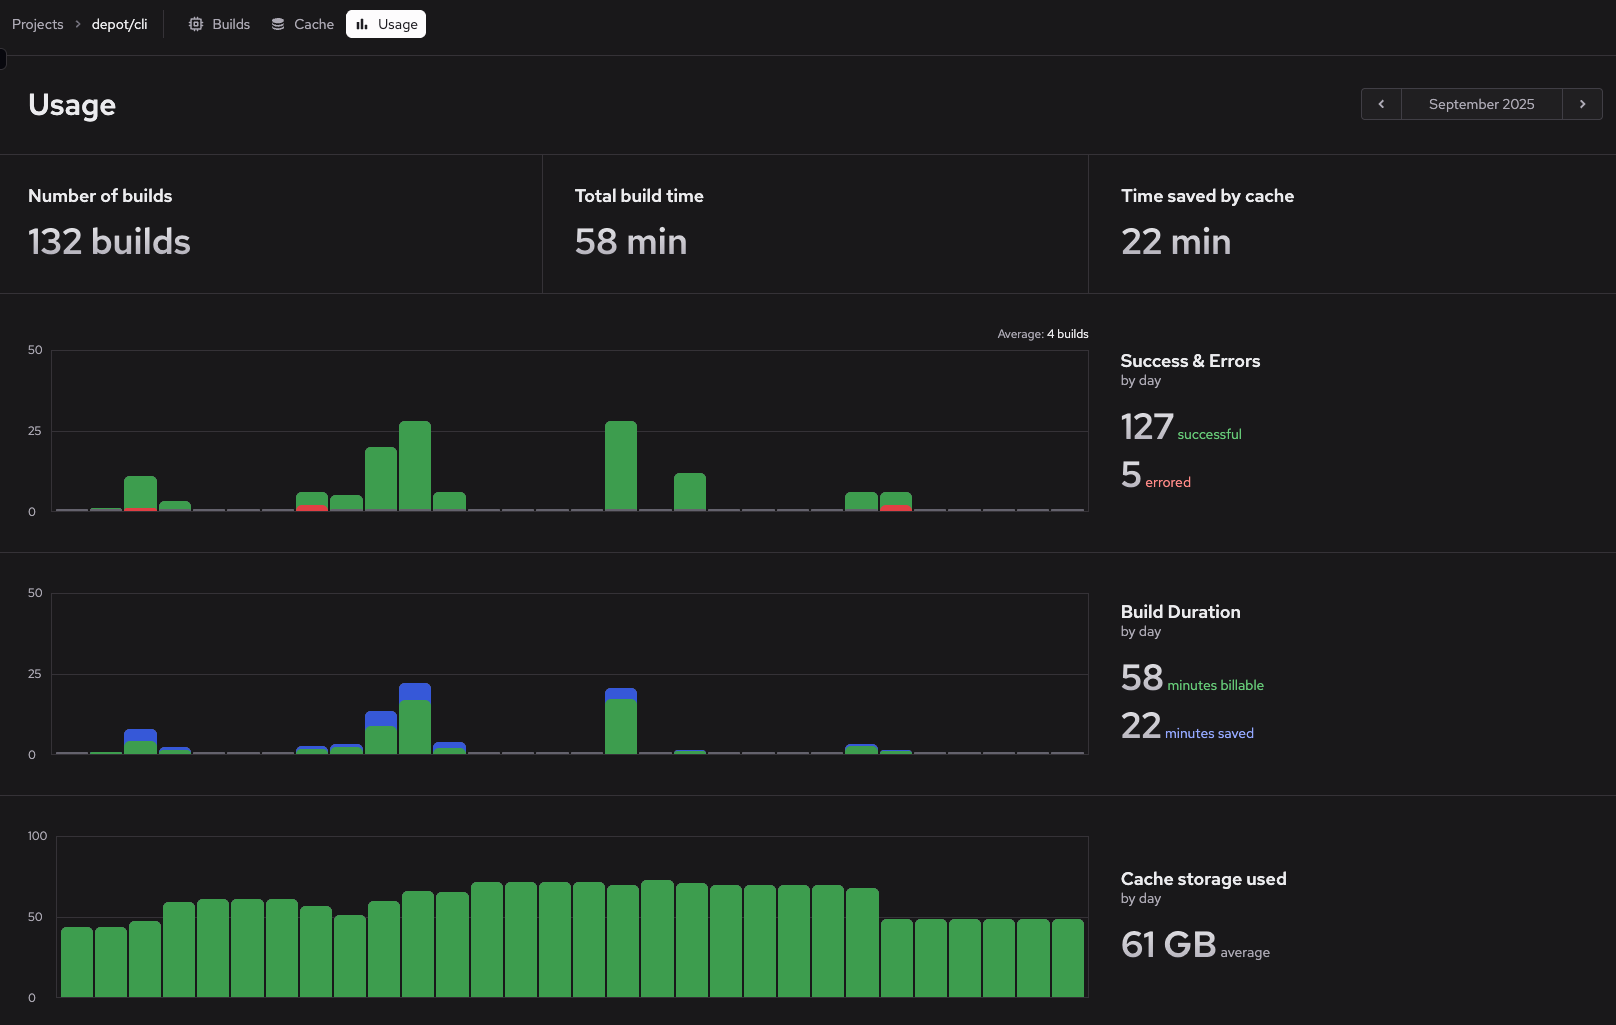
The usage page summarizes the following for the selected month:
- Number of builds
- Total build time
- Time saved by cache
- Number of successful and unsuccessful builds by day
- Build duration total by day
- Cache storage used by day
Hover on any day in the charts to filter the view and see statistics for that day.
Analyze and optimize container build performance
The following are some common scenarios for analyzing and optimizing container build performance.
Identify slow builds
To find builds that are taking longer than expected:
- Go to your organization's projects page.
- Click a project.
- Review the Build duration chart for bars that are noticeably higher than others.
- Click on slow builds to investigate.
In the build details, examine:
- Which steps took the longest (shown in the Logs view).
- Whether cache performance is good (number of steps cached).
- The build context size and composition (Context tab visible when builds send files to the builder).
Click on individual steps to see their runtime trends. Steps that have recently slowed down might indicate:
- Dependency updates, build context changes, or other cache invalidation issues that increased build time.
- Network issues affecting package downloads.
- Resource constraints on the builder.
Debug build failures
When builds fail, Depot provides metrics to help you understand the scope and cause.
Recent build health
The project builds page (Go to projects page and click a project) shows status indicators for all recent builds. Multiple consecutive failures might indicate:
- Broken Dockerfile or build configuration.
- Missing dependencies or registry access issues.
- Resource constraints causing builds to fail.
Build health visualization
On the organization usage page, each project displays a health bar showing the outcomes of the last 30 builds. This visual indicator helps you quickly identify projects with:
- Consistent failures (many red indicators).
- Recent failure spikes (sudden appearance of red indicators).
- Generally healthy builds (mostly green indicators).
Once you've identified a problematic build, investigate the causes:
- Use the build logs to see error messages.
- Refer to the troubleshooting guide for solutions to common errors.