GitHub Actions has always been a bit of a black box. Throw some YAML together, and it will duly execute your build scripts. But as your pipeline grows in complexity, it offers no useful data about how those scripts are performing, let alone insights into how to improve them.
You can compare successive build durations or squint vaguely at log timestamps, but both of those are poor proxies for concrete telemetry from the underlying host. You might take a wild guess that you're CPU-bound, increase your runner size, and trigger a rebuild. If it's faster, great; if not, take another shot in the dark.
This feedback loop is brutal, and I don't envy you if you're trying to optimize builds on vanilla GitHub Actions today. It’s no wonder that CI telemetry has been one of our most requested features, to help customers reason about build performance, and to measure performance improvements in a more controlled fashion. In this post we’ll dig a little deeper into how our GitHub Actions telemetry is wired together under the hood.
Wiring up the collector
In Depot, every GitHub Job maps to its own dedicated EC2 instance, where we run our agent daemon and the GitHub Actions runner. That runner will connect to the GitHub control plane on launch and execute any instructions it receives. Additionally, we boot an OpenTelemetry Collector when the job begins to regularly sample system metrics like CPU and memory utilization. If a job step is indeed CPU-bound, the collector would report high CPU utilization for its duration.
Enabling the hostmetrics receiver was all we needed to do to start scraping metrics, but collecting job logs was a bit more involved. The runner binary doesn’t capture these logs in a file, but rather streams stdout and stderr straight to its control plane for storage and later display in the UI. We decided to fork actions/runner to dual write these logs to a file, which in turn the collector could tail with filelog, enrich with resourcedetection, and coerce into semantic conventions with transform.
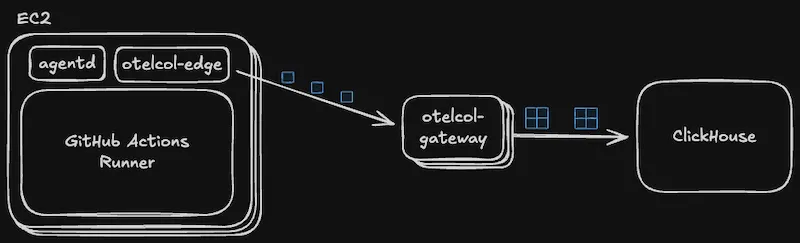
We deploy the OTel collectors in a standard gateway architecture, with edge collectors delivering telemetry to a cluster of gateway collectors. The former are responsible for enriching and batching telemetry from individual hosts. The latter collates many disparate batches together into a bulk payload to forward to ClickHouse as a final destination.
Storing telemetry at scale
We’ve been happy ClickHouse users for a couple of years now, and in general have been impressed with its baseline performance and cost. It seemed like a natural fit for this new timeseries use case, and many blog posts and resources gave us the confidence that we could scale this solution as we grew. But enabling this pipeline for all GitHub Job telemetry (and, for that matter, depot build telemetry) meant operating at a new-to-us scale. Today, we process millions of jobs per day, and we needed some initial tweaks to ensure our ingest and query paths were operating smoothly.
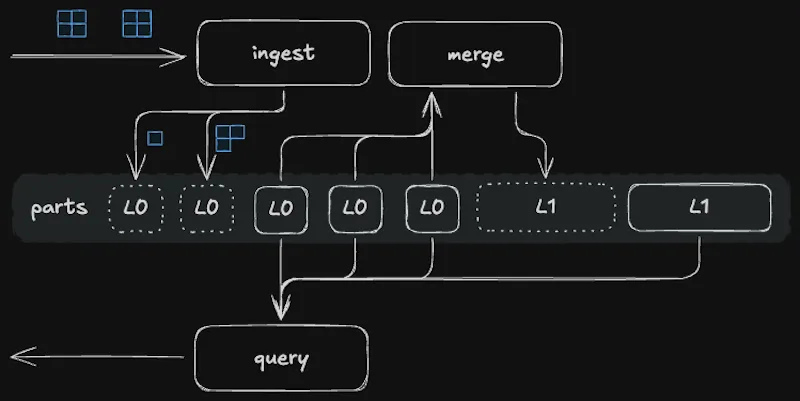
ClickHouse organizes table data into directories called parts, and each insert creates one or more parts. In the background, the MergeTree table engine will combine and compact data from smaller, newer parts into larger, contiguous parts. This keeps the count of active parts low and thus reduces the number of files to scan at query time. Query performance will slowly degrade if part creation outpaces part merging, and so ClickHouse does best when inserts are large and infrequent. Batching in the OTel gateway and asynchronous inserts both combine to keep insert rate in check.
ClickHouse can scan millions of rows per second, and so smaller tables are queryable with reasonable latencies regardless of table structure. But when ingest blossoms to millions of rows per minute, it pays to design the table’s primary key around its main query pattern to help the query engine skip as much work as possible. In our case, that means choosing a key like (metric_name,machine_id) which creates a corresponding primary index of columns that are nearly always present in the where clause.
This works great if this is your only query pattern, but we rely on a handful in order to present this data to end users. The above primary index is great for looking up cpu_utilization for single jobs but isn't much help in aggregating cpu_utilization over multiple jobs in an organization. With a relational database like MySQL, we might add a secondary compound index on something like (metric_name,org_id,job_name), but each ClickHouse table is restricted to just a single index derived from its primary key. Secondary indexes do exist, but they can only further narrow what the primary index has already selected, not provide an alternative way to filter data.
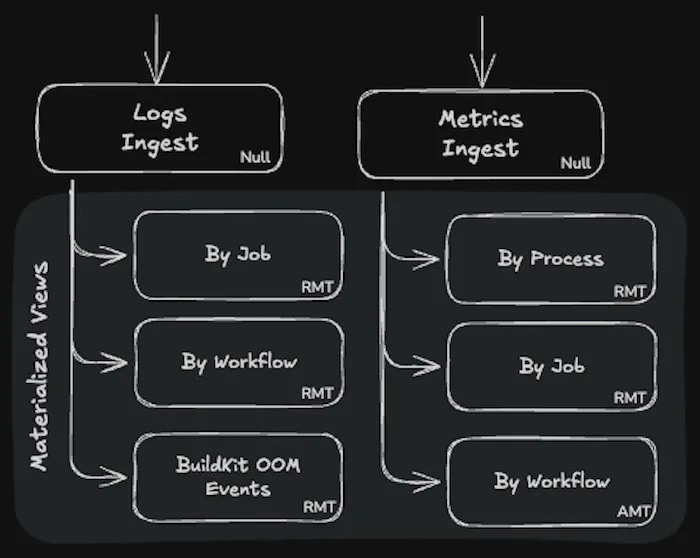
To get the same behavior, we use materialized views to dual write the data into a new table with a different primary index. A new table per distinct query pattern gives us the flexibility to slice and dice (and preaggregate) the data any way we need. Indeed, there now exist multiple copies of the data, but being able to navigate billions of records in tens of milliseconds is a worthwhile tradeoff.
One thing to note is that chains of materialized views cause additional synchronous inserts at ingest time, amplifying the number of parts generated. This suggests a tension between optimizing the read and write paths, but we have yet to experience this firsthand.
Finally, we display this data to the end user. For example, when you navigate to the GitHub Actions Analytics page, our app backend issues a number of parallel requests to ClickHouse, with each distinct query pattern dispatched to its corresponding table. Their result sets are then fed back into charts and hopefully help you uncover a hotspot or two in your build pipeline.
Putting the data in your hands
We’ve always chosen to operate as if we were an extension of your engineering team. That’s reflected in our relentless drive to make your builds faster as well as our deep investment in making support as frictionless as possible when you need it. Customers will often approach us to explore ways to optimize their build times, or to troubleshoot builds that have gone awry. We’ve traditionally had telemetry available to us internally to help us better understand our customers’ environments and to point people in the right direction.
Committing to a great support experience has been rewarding, and has given us an opportunity to contend with the problems our customers face on a daily basis. But as we scale, we inevitably have to find ways to help customers answer their own questions. Exposing build telemetry to customers makes it self-serve, which has preempted a number of support interactions where the solution was self-evident. In other cases, we’re still eager to dive in with you, and we’ve found it particularly helpful to frame our conversations around a common dataset.
Now that telemetry is available at your fingertips, a new class of questions is inexpensive to ask. The following are some of the ways customers are troubleshooting and optimizing their build pipelines:
- Reviewing trends over time for sudden changes or gradual degradations in job performance or utilization
- Recognizing when a runner is clearly overprovisioned, and either cutting cost by switching to a smaller runner, or making better use of available resources (for example, by running test suites with greater parallelism)
- Recognizing when CPU or RAM is pegged, and either using a larger runner with more headroom, or else isolating the offending command for an immediate optimization pass
- Responding to BuildKit OOM events by either vertically or horizontally scaling the BuildKit host
- Navigating logs for a particular job, or performing needle-in-haystack queries across logs from all jobs, e.g. for narrowing down when a panic was introduced, or auditing for exposure to an npm supply chain attack.
Learn more about GitHub Actions metrics and analytics and logs in our docs.
From black box to observable
GitHub Actions doesn't have to be a black box. With CI telemetry, you can see exactly what's happening while your jobs run. No more guessing, no more shots in the dark.
You can access GitHub Actions analytics in your Depot dashboard. Take a look and see what your builds have been hiding.
FAQ
How does Depot collect CPU and memory metrics from GitHub Actions runners?
We run an OpenTelemetry Collector on each EC2 instance alongside the GitHub Actions runner. The collector uses the hostmetrics receiver to regularly sample system metrics like CPU and memory utilization throughout the job's execution. For logs, we forked the actions/runner to dual write stdout and stderr to a file, which the collector tails with filelog, enriches with resourcedetection, and transforms into OpenTelemetry semantic conventions. The edge collectors then batch this telemetry and forward it through gateway collectors to ClickHouse.
Why does Depot use ClickHouse instead of a traditional time-series database?
We've been happy ClickHouse users for a couple of years now, and it seemed like a natural fit for this new timeseries use case. At our scale (millions of jobs per day), we needed something with proven baseline performance and reasonable cost. ClickHouse can scan millions of rows per second, and with proper table design around primary keys, we can navigate billions of records in tens of milliseconds. The MergeTree table engine handles part merging efficiently when we batch inserts properly.
How do you support different query patterns in ClickHouse with only one primary index per table?
We use materialized views to dual write the data into multiple tables, each with a different primary index tailored to
a specific query pattern. For example, one table has a primary key of (metric_name,machine_id) which is great for
single job lookups, while another uses (metric_name,org_id,job_name) for aggregating metrics across multiple jobs in
an organization. This gives us the flexibility to slice and dice the data however we need without relying on secondary
indexes, which can only narrow what the primary index has already selected.
How do I know if my Depot GitHub Actions runner is undersized or oversized?
Look at your CPU and memory utilization graphs. If CPU or RAM is pegged throughout the job duration, you're undersized and should either use a larger runner or isolate the offending command for optimization. If your runner shows low utilization consistently, you're overprovisioned and can cut costs by switching to a smaller runner, or make better use of available resources by increasing parallelism in your test suites.
Related posts
- Now available: GitHub Actions analytics
- Introducing GitHub Job Details: Observability for your CI/CD pipeline
- Now available: GitHub Actions log search
