Developers love data, but until now, seeing how your GitHub Actions perform across jobs has been tricky. How long do jobs really take? Which jobs use up the most CPU? Are things getting faster or slower over time?
Today, we’re launching Analytics for GitHub Actions, a brand new way to understand your GitHub Actions jobs at a glance. With visual trends, job insights, and system metrics over time, you can finally see what’s working, what’s not, and where to optimize next.
We now provide the following analytics:
- Performance trends: Track job duration, success rates, and failure rates over time
- Resource utilization: Monitor CPU and memory usage across all your jobs
- Job breakdowns: Identify your slowest jobs and highest CPU consumers
- Smart filtering: Drill down by repository, runner type, or specific jobs
- Job-level detail: Click into individual jobs to see logs, metrics, and performance data
- Optimization recommendations: Get actionable suggestions for improving build performance
Analytics round-up
Visit your organization's GitHub Actions Analytics page. You can get there any time by clicking the Analytics tab at the top of your GitHub Actions page in the Depot dashboard.
Summary section
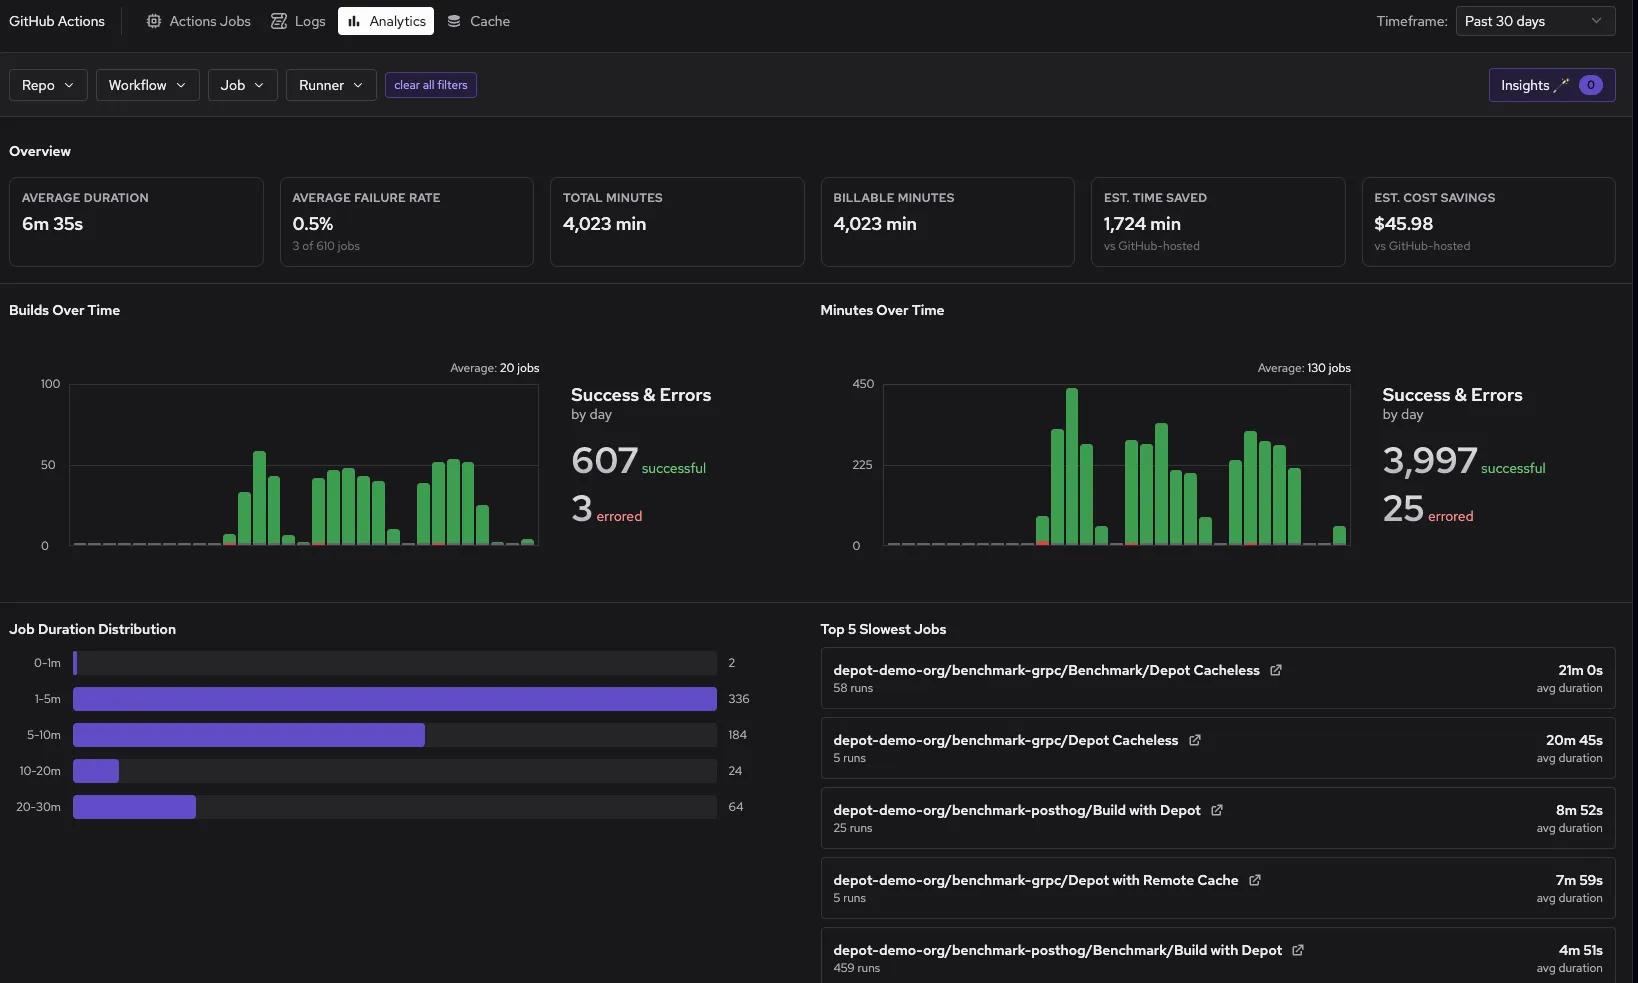
The summary section gives you everything you need to know about your GitHub Actions at a glance. To filter by time range, select a Timeframe from the dropdown in the upper right. Then filter by repo, workflow, job, or runner to drill into exactly what you need. The summary includes:
- average duration and failure rates
- total minutes consumed
- estimated cost savings compared to GitHub-hosted runners
- builds and minutes over time
- job duration distribution
- the slowest jobs
Job Duration Trends
Track how your jobs’ durations change over time. See if that optimization actually worked, spot performance regressions before they become problems, and compare multiple jobs side by side. Each job shows its average duration, percentage change, and total run count so you know exactly what’s improving and what’s getting slower.
We used this particular feature recently. While working on the analytics page, I noticed this huge drop in the time for one of our jobs.
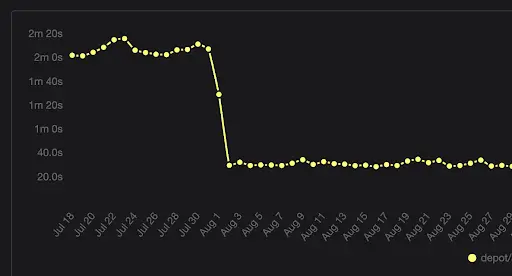
Asking around the company, no one seemed to know why, so I went to investigate. Turns out, a routine dependency upgrade significantly improved performance in this case! Performance improvements (or regressions) like this would have been much harder to spot before the analytics page.
Job Failure Rates
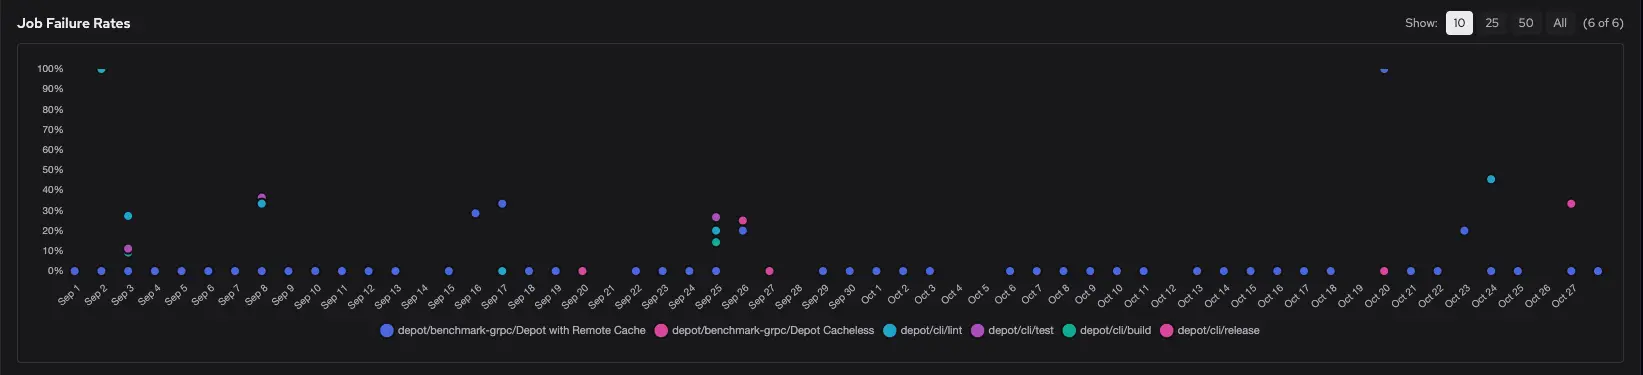
Keep tabs on job reliability over time. See when failures spike, compare failure rates across jobs, and get the total number of failures alongside run counts. Whether you’re tracking down flaky tests or monitoring CI stability after a change, you’ll know exactly which jobs are failing and when.
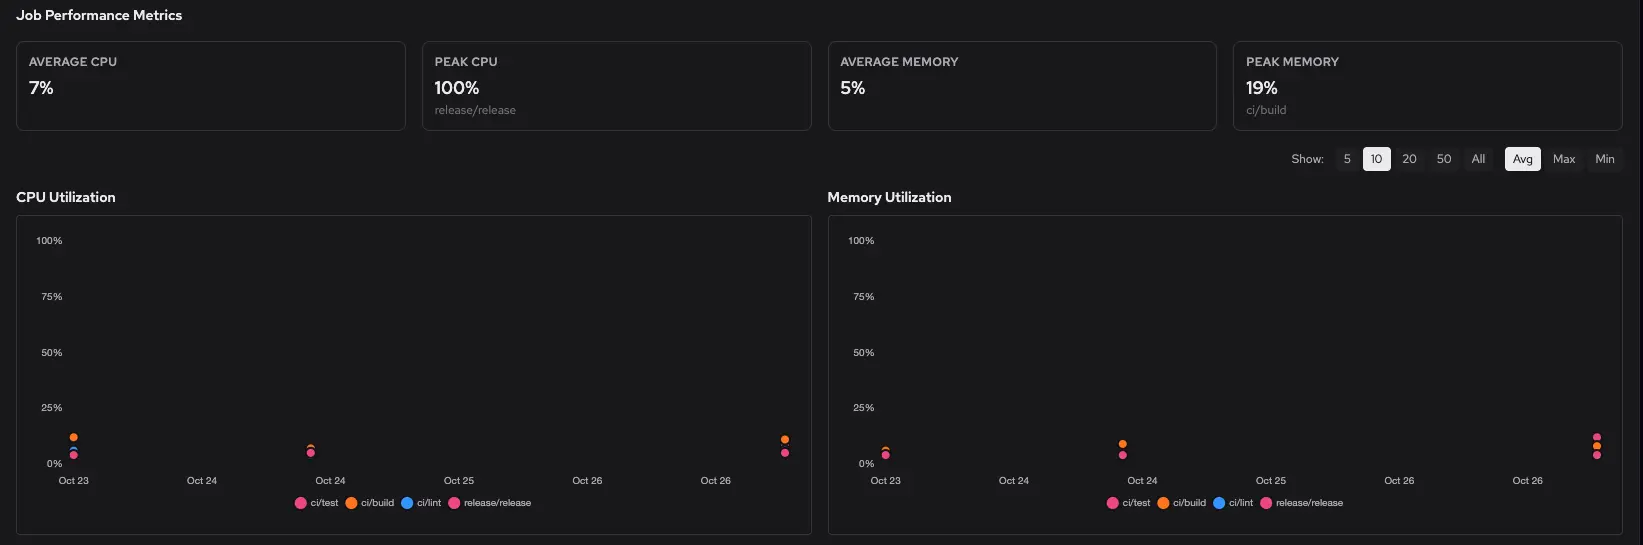
Job Performance Metrics
See how your jobs are actually using CPU and memory. Get average and peak utilization metrics, then drill into the scatter plots to spot outliers and patterns across your jobs. Click through to the highest peak jobs to investigate what’s pushing your runners hardest. Perfect for figuring out if you need bigger runners or if your jobs are underutilizing what you’ve got.
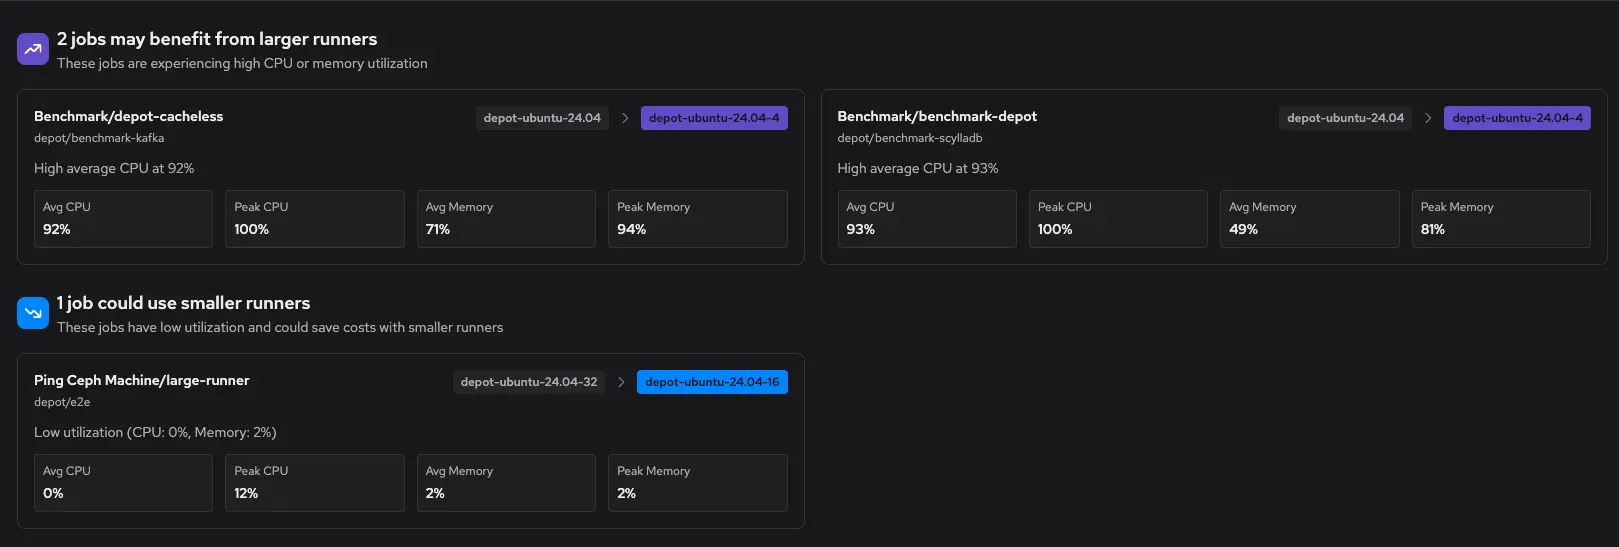
Insights
Last but certainly not least: the insights page. No more guessing at runner sizing. The insights page automatically analyzes your jobs and tells you if any of them are maxing out their runners or wasting resources. Get specific recommendations to upgrade jobs hitting CPU or memory limits, or downgrade low-utilization jobs to save costs.
Fin
GitHub Actions analytics is available now for all Depot customers. Head to your organization’s GitHub Actions Analytics page to start exploring your job performance. Visit our community Discord if you have questions or feedback about the feature.
Related posts
- Now available: Github Actions log search
- Now available: Detailed Depot usage and GitHub Actions analytics
- Real time visualization and monitoring of GitHub Actions Runners & Jobs
- Comparing GitHub Actions and Depot runners for 2x faster builds
