We're excited to announce that GitHub Job Details are now viewable directly within the Depot app. This powerful new feature brings observability to your GitHub Actions workflows, giving you visibility into job performance, resource utilization, and debugging capabilities. Each Job Detail page focuses on a single in progress or completed job run, highlighting the important details of your job’s execution.
Why GitHub Job details matter
GitHub Actions are the backbone of modern CI/CD pipelines, but when jobs fail or perform poorly, debugging can be frustrating as details are frequently less visible to the end user. In GitHub’s UI, logs are collapsed by default, making it difficult to see the full picture of what happened during execution. Resource constraints like memory or CPU bottlenecks often go unnoticed until they cause failures, since information about them is not always available.
This new Job Details page solves these problems by providing a comprehensive view of your job execution with both logs and metrics in one unified interface. Now you can quickly identify performance bottlenecks, identify resource usage patterns, and debug issues with the context you need.
OpenTelemetry-powered observability
We've deployed an OpenTelemetry (OTEL) collector directly on Depot action runners that continuously captures observability data while your job executes. This data is stored and made available for immediate retrieval through the Depot app.
Data collected includes:
- Memory utilization metrics with sub-second granularity throughout the job lifecycle
- CPU utilization metrics with detailed timing information
- Complete job logs with step associations
- Process-level resource utilization for granular visibility
- Out of memory (OOM) events with detailed timing information
This enables all the advanced features detailed below, from interactive log searching to metrics correlation.
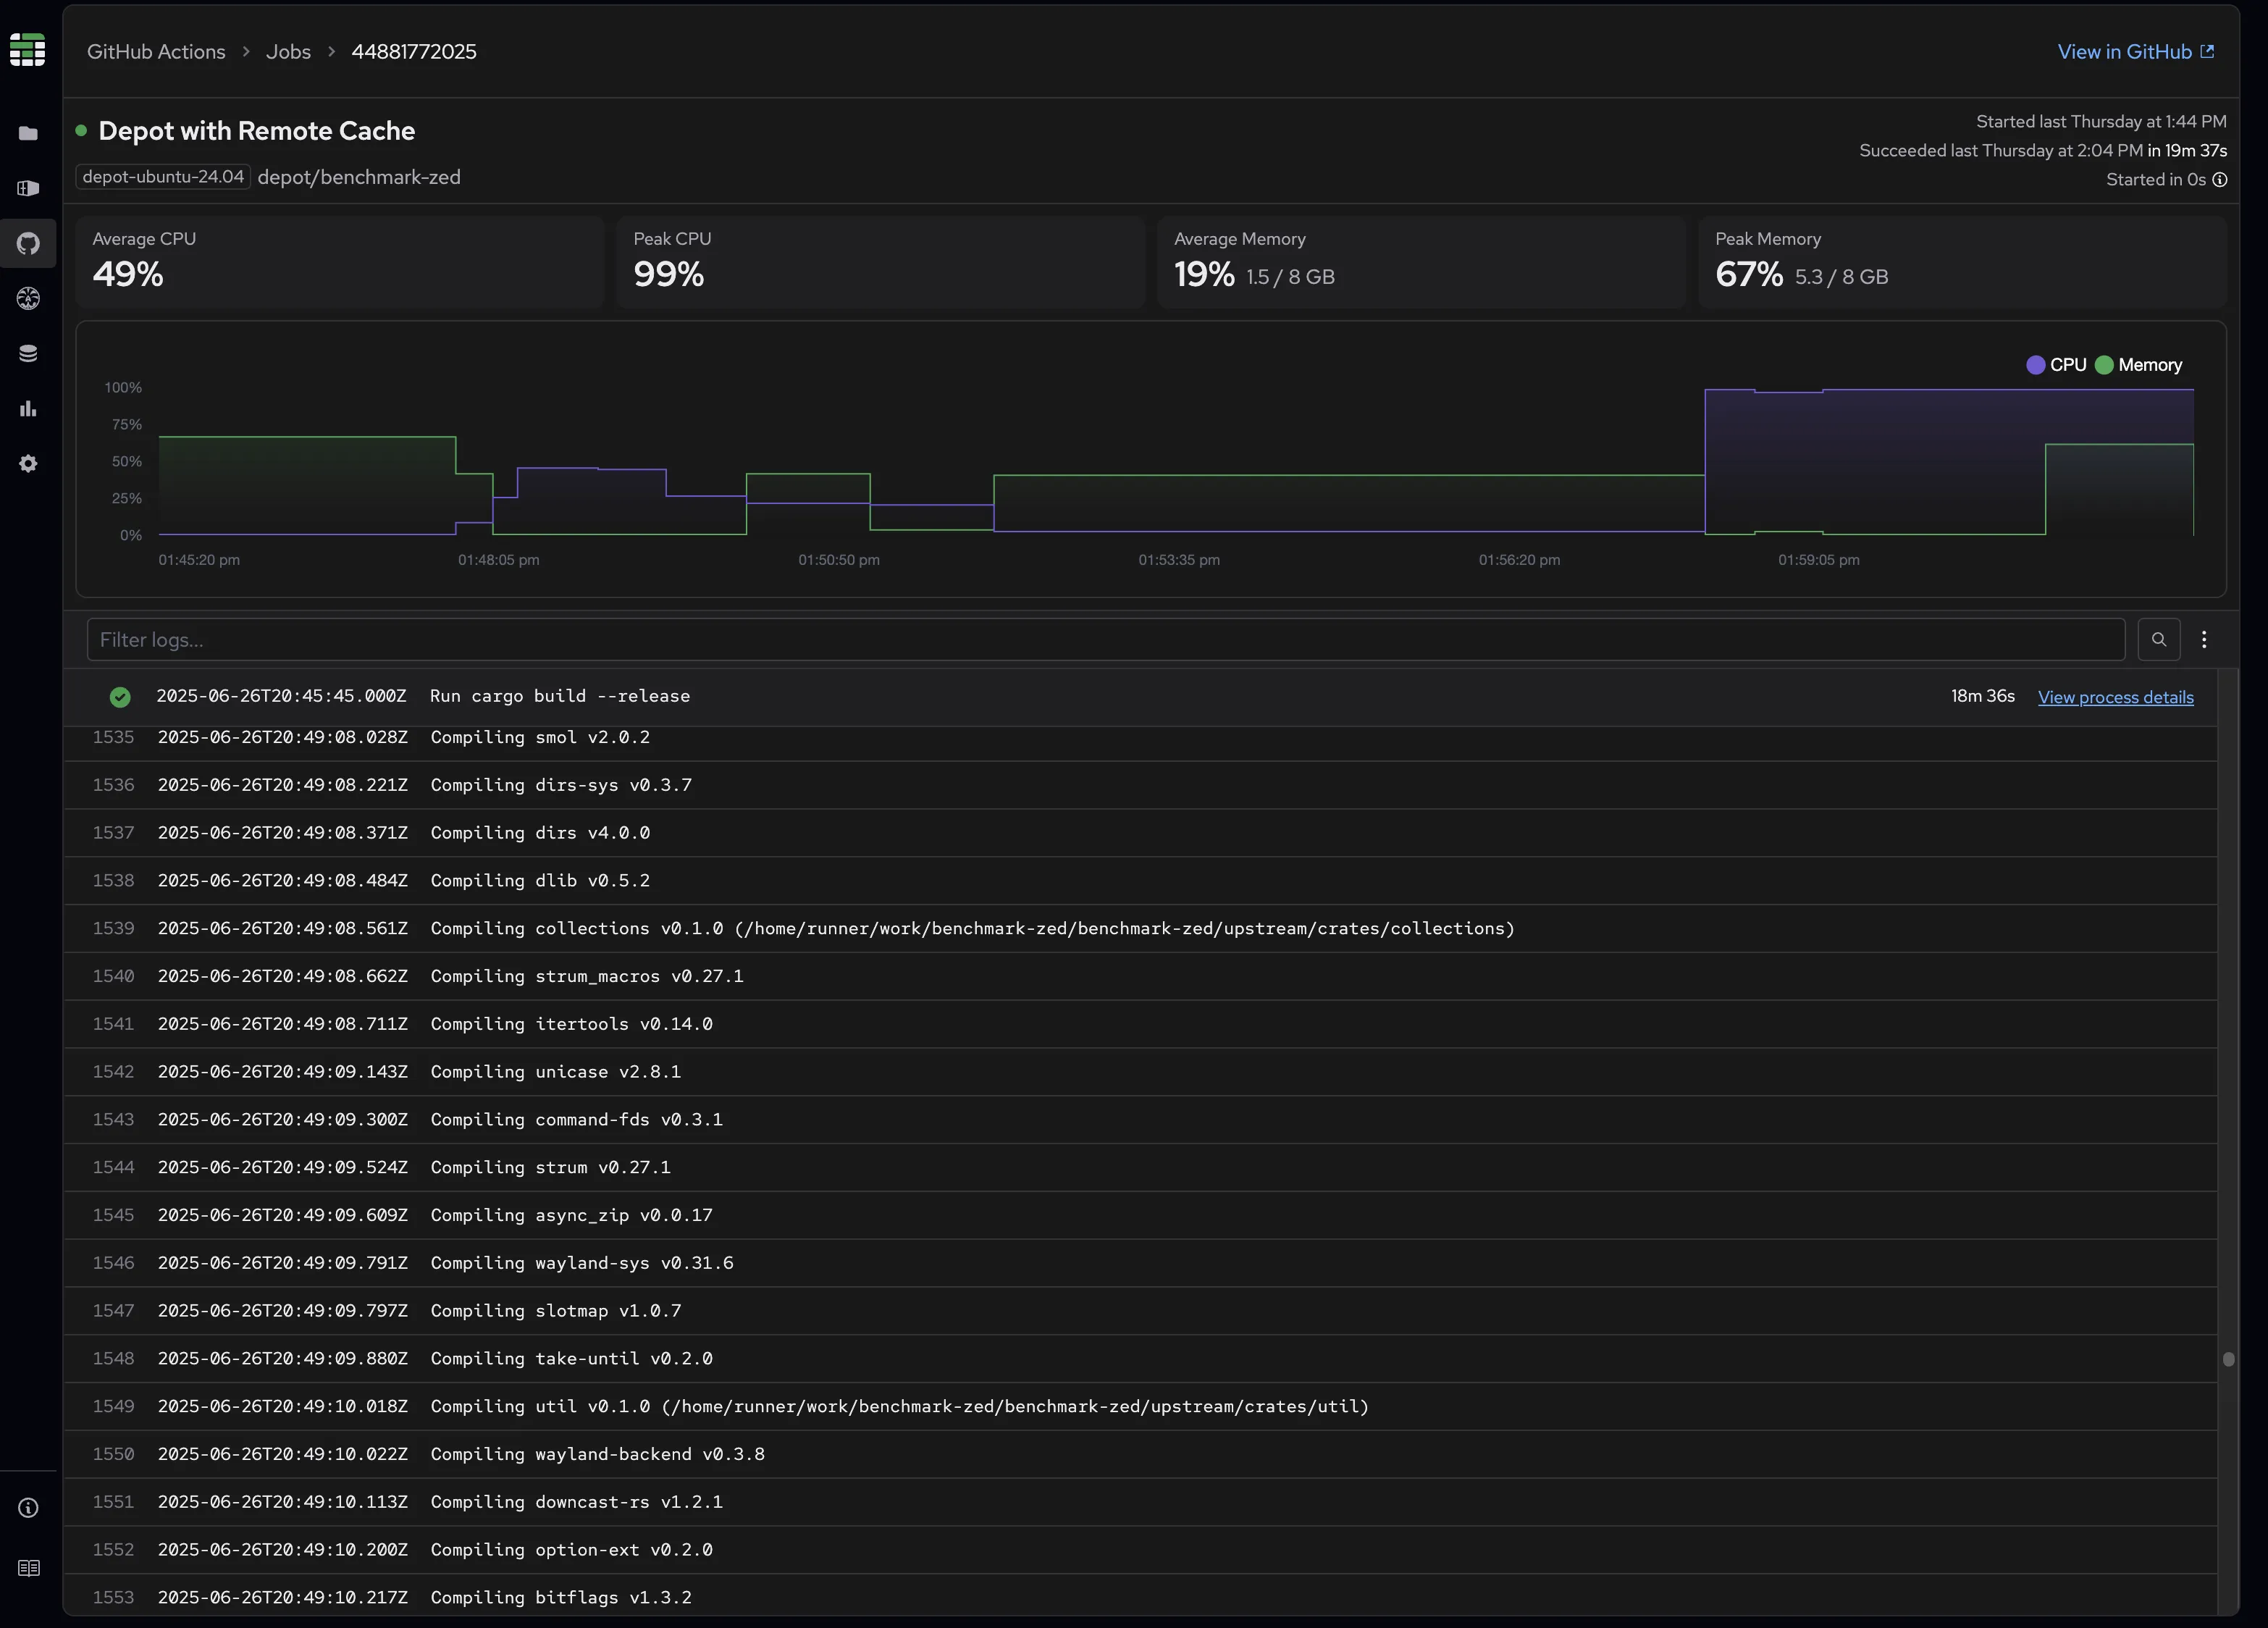
Comprehensive metrics
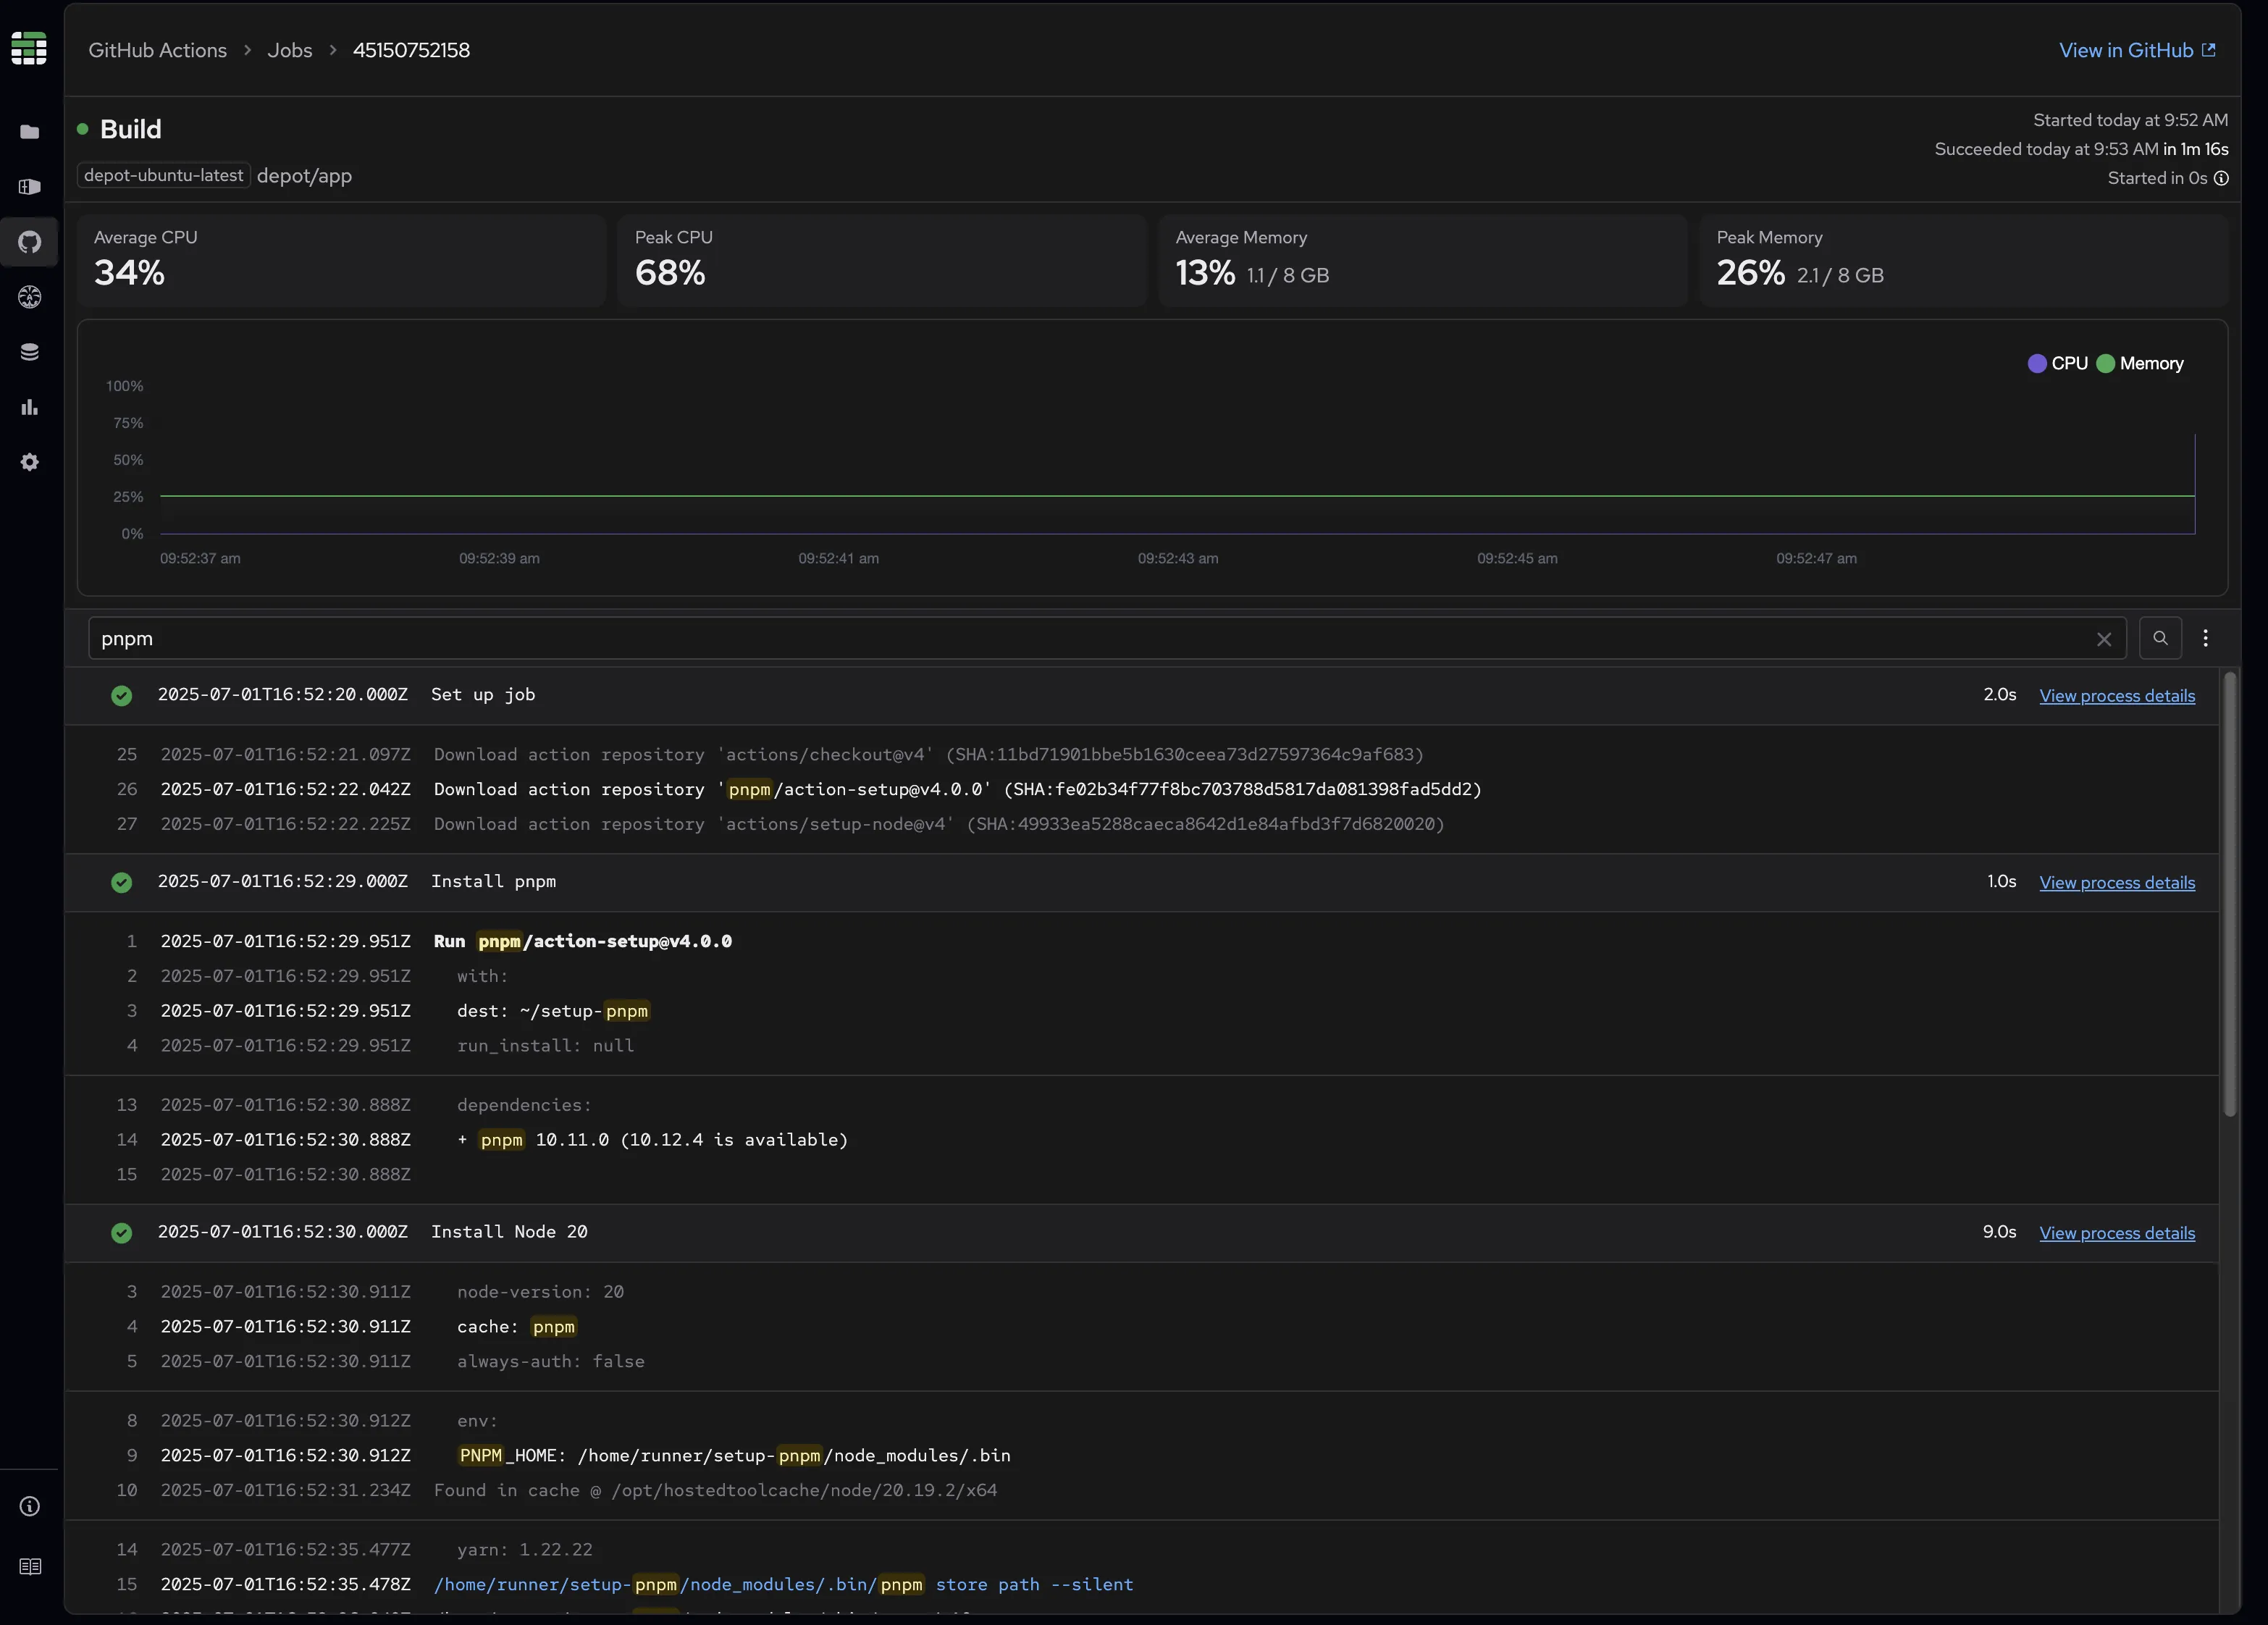
At the top of each Job Detail page, you'll find graphs showing your job's resource consumption over time. These visualizations make it easy to spot resource spikes, identify performance patterns, and correlate resource usage with specific build steps.
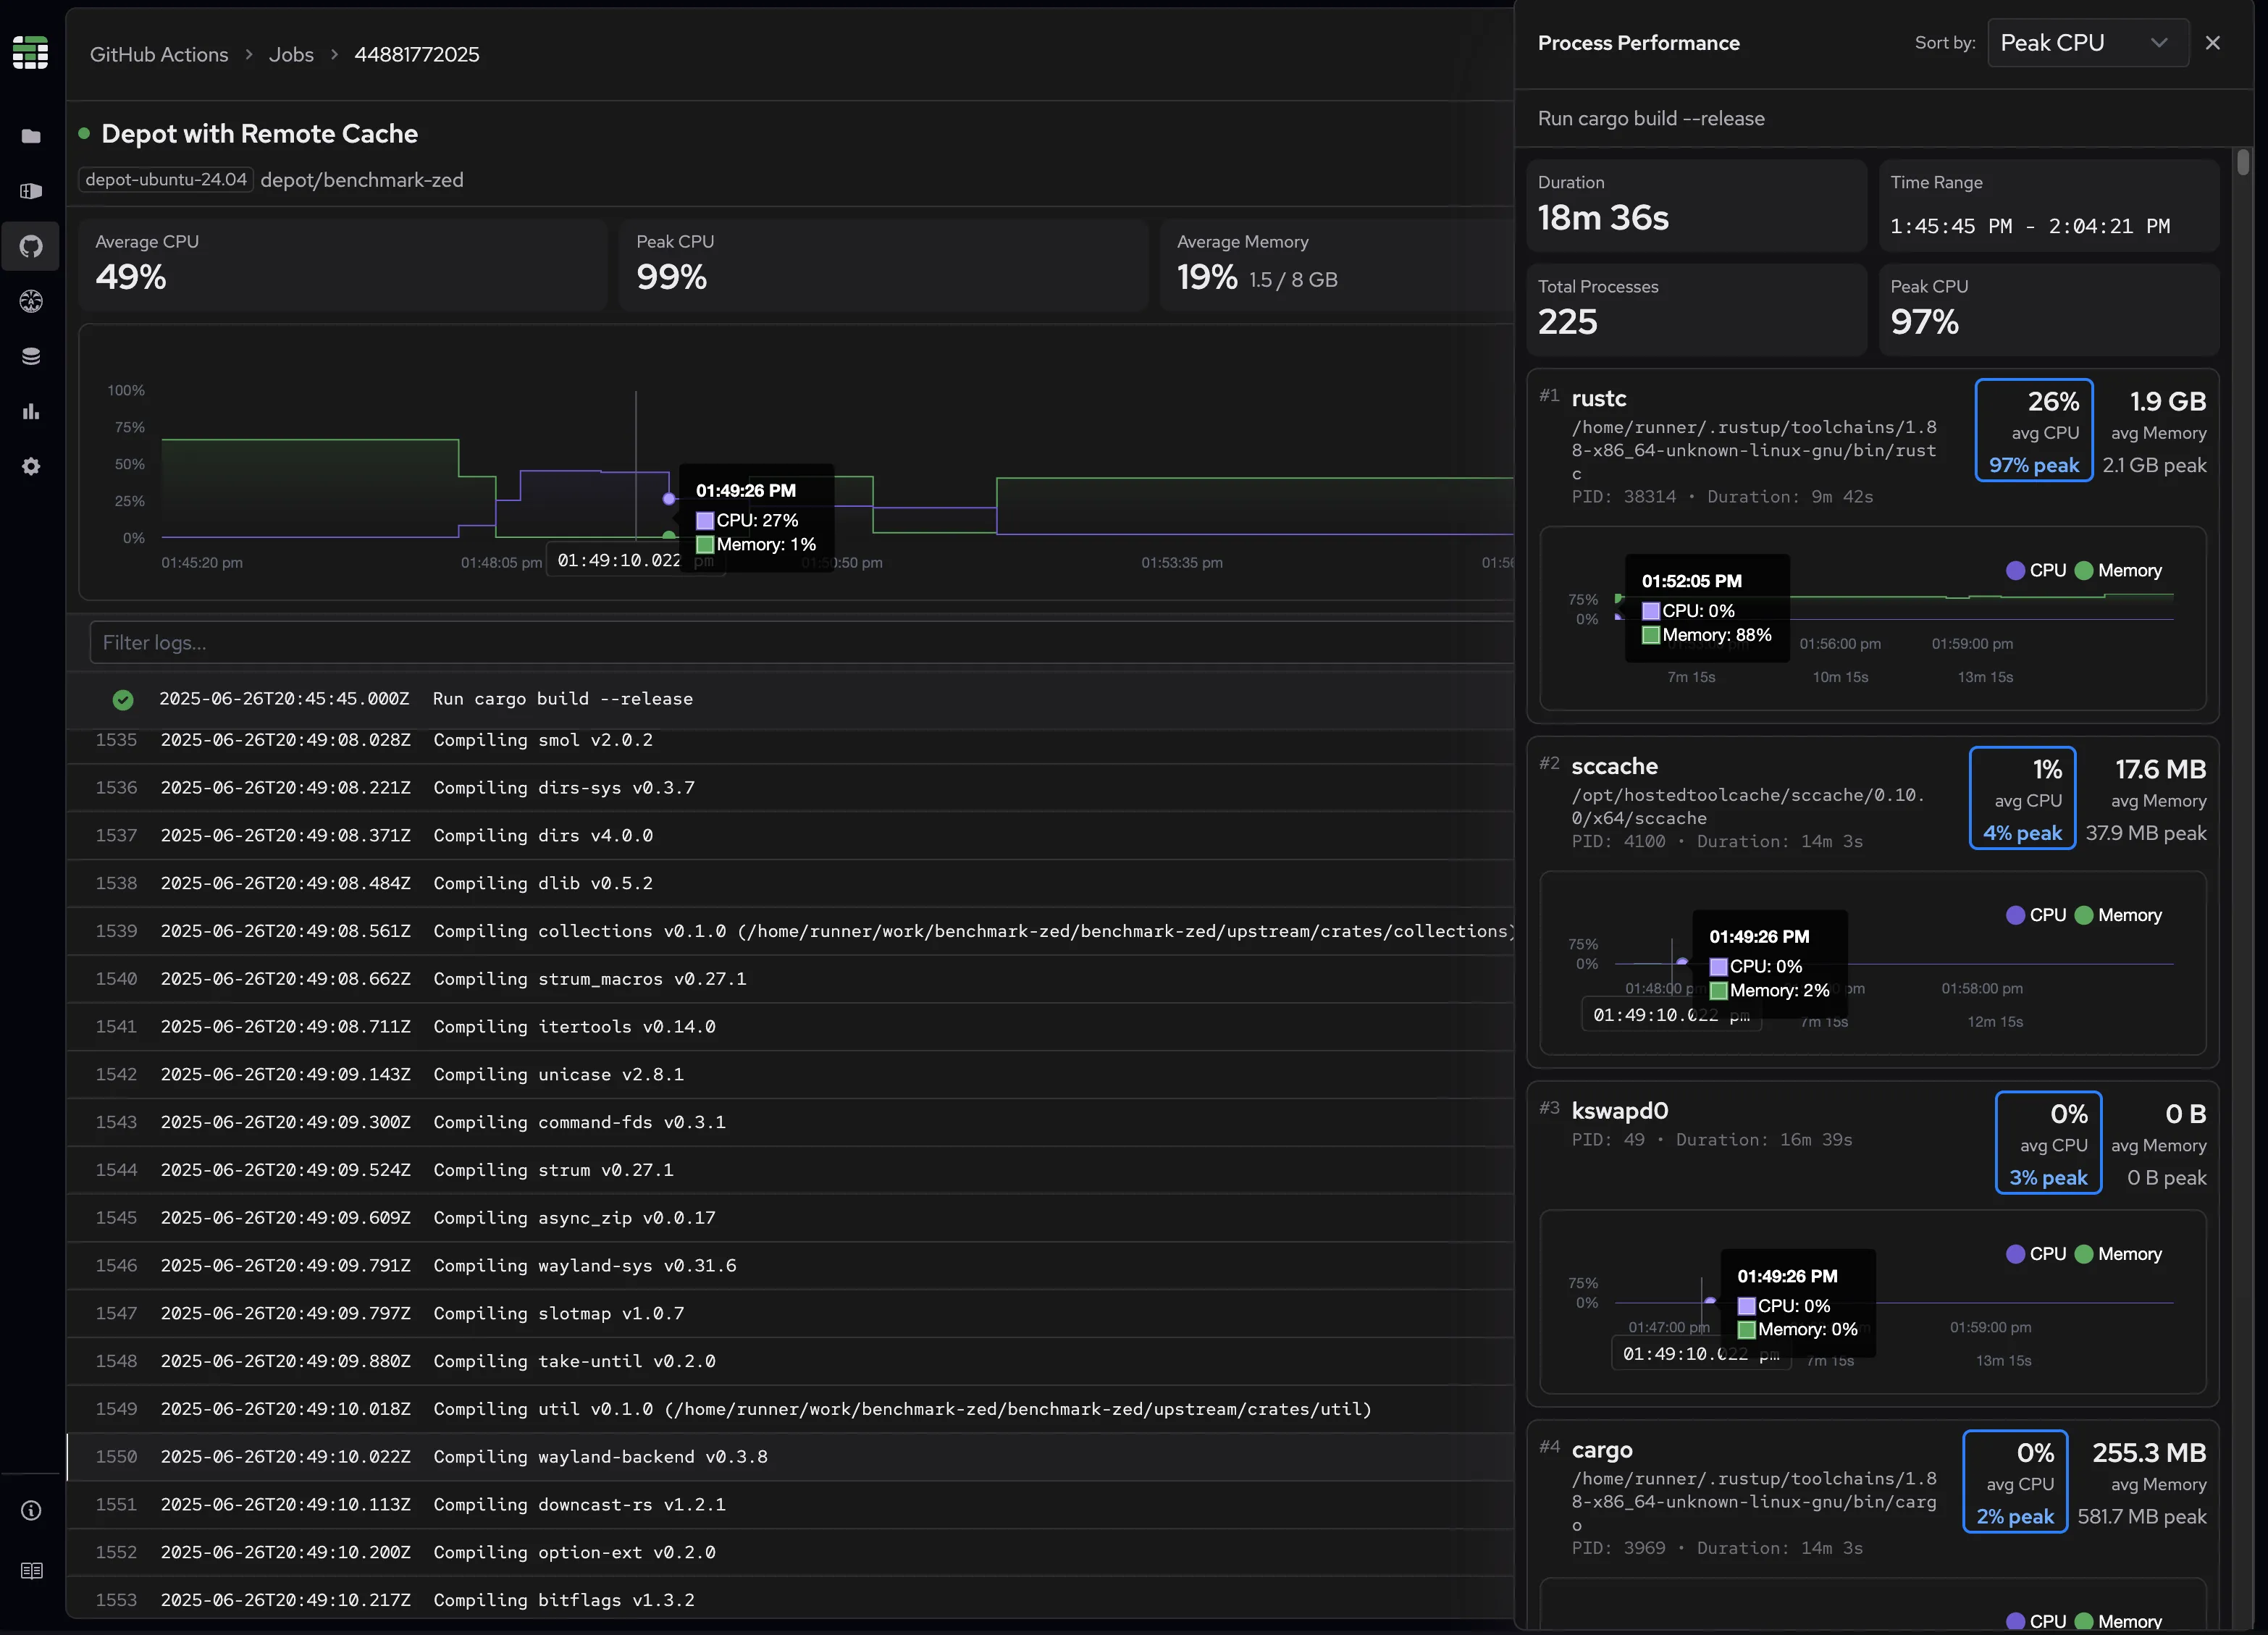
For deeper analysis, click on any step to view individual process metrics. You can sort processes by resource usage to quickly identify which processes are consuming the most resources during execution.
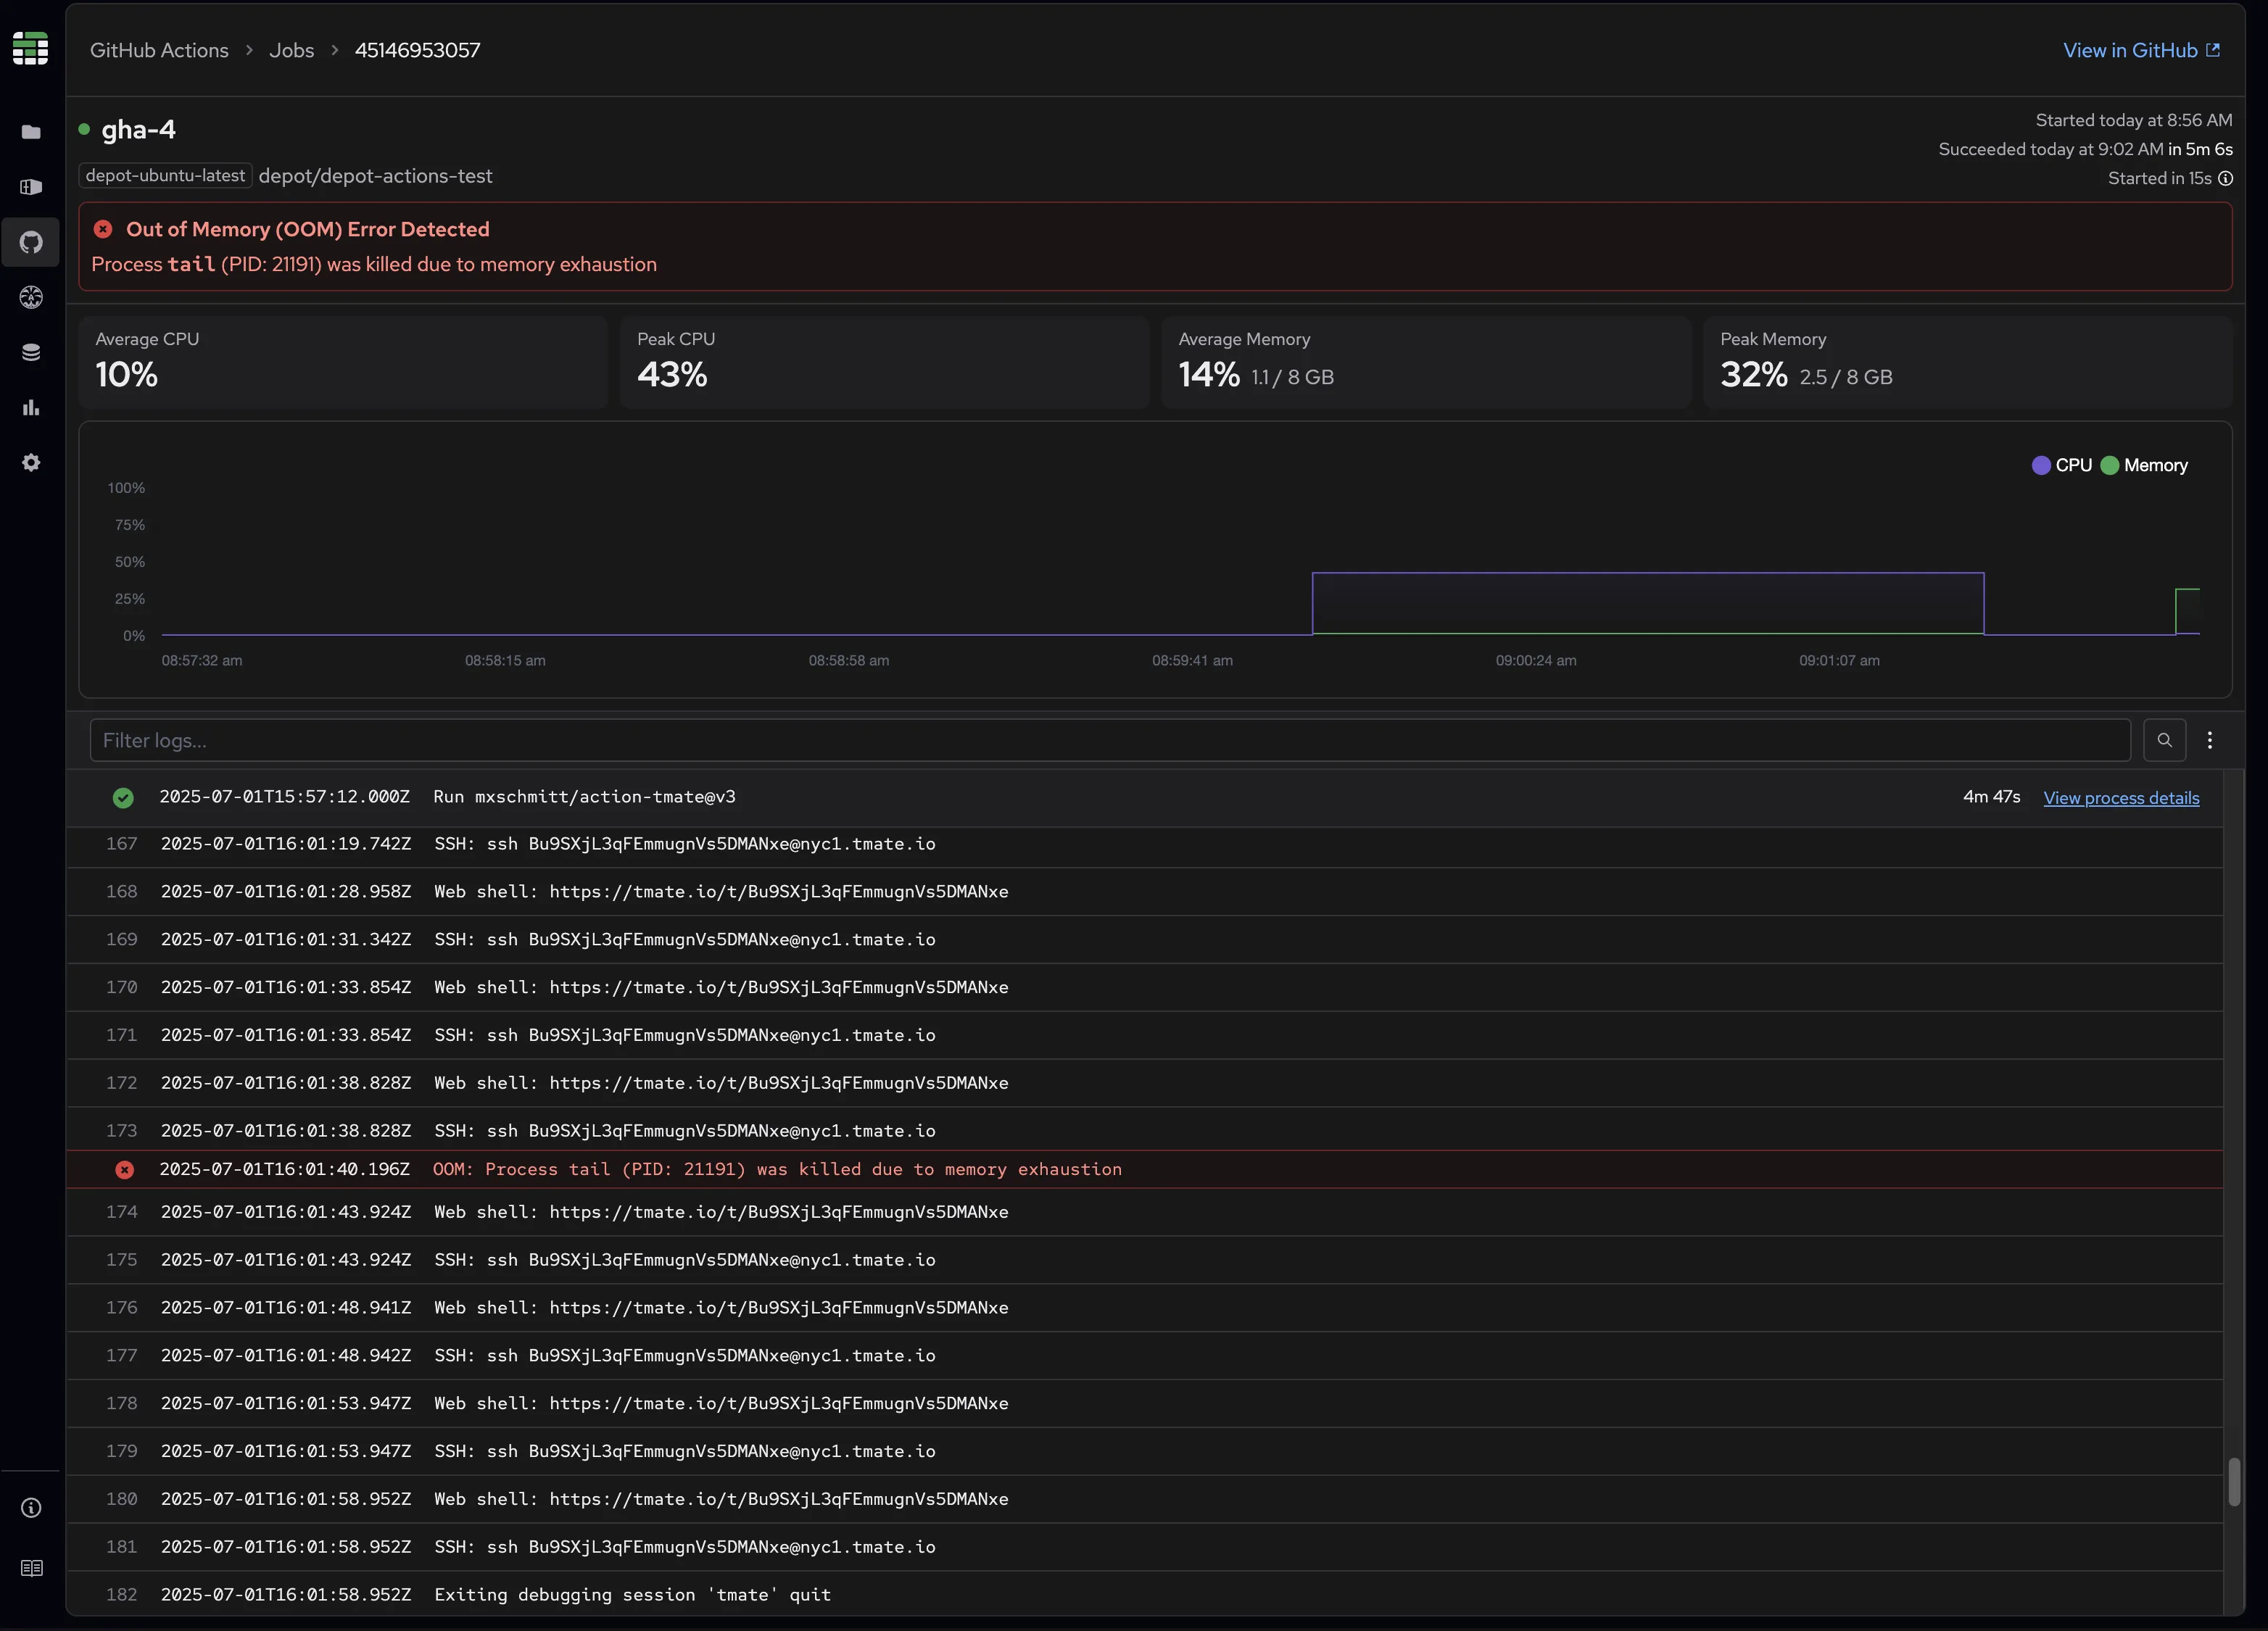
Out of memory detection
We automatically detect and highlight Out of Memory (OOM) events, both in the job overview and within the log view itself. No more guessing whether memory constraints caused your job to fail. We showcase where and when an event has occurred as well as which process was the culprit.
Advanced logging features
Unlike GitHub's default collapsed view, our Job Detail page displays all logs in a standard observability format where you can see everything uncollapsed in one continuous view and see when exactly this log occurred. As you scroll through logs, you can always see which step each log entry belongs to, maintaining crucial context.
Contextual search results
Our search functionality supports free text search in the log body, making it easy to find specific errors, warnings, or events within your logs.
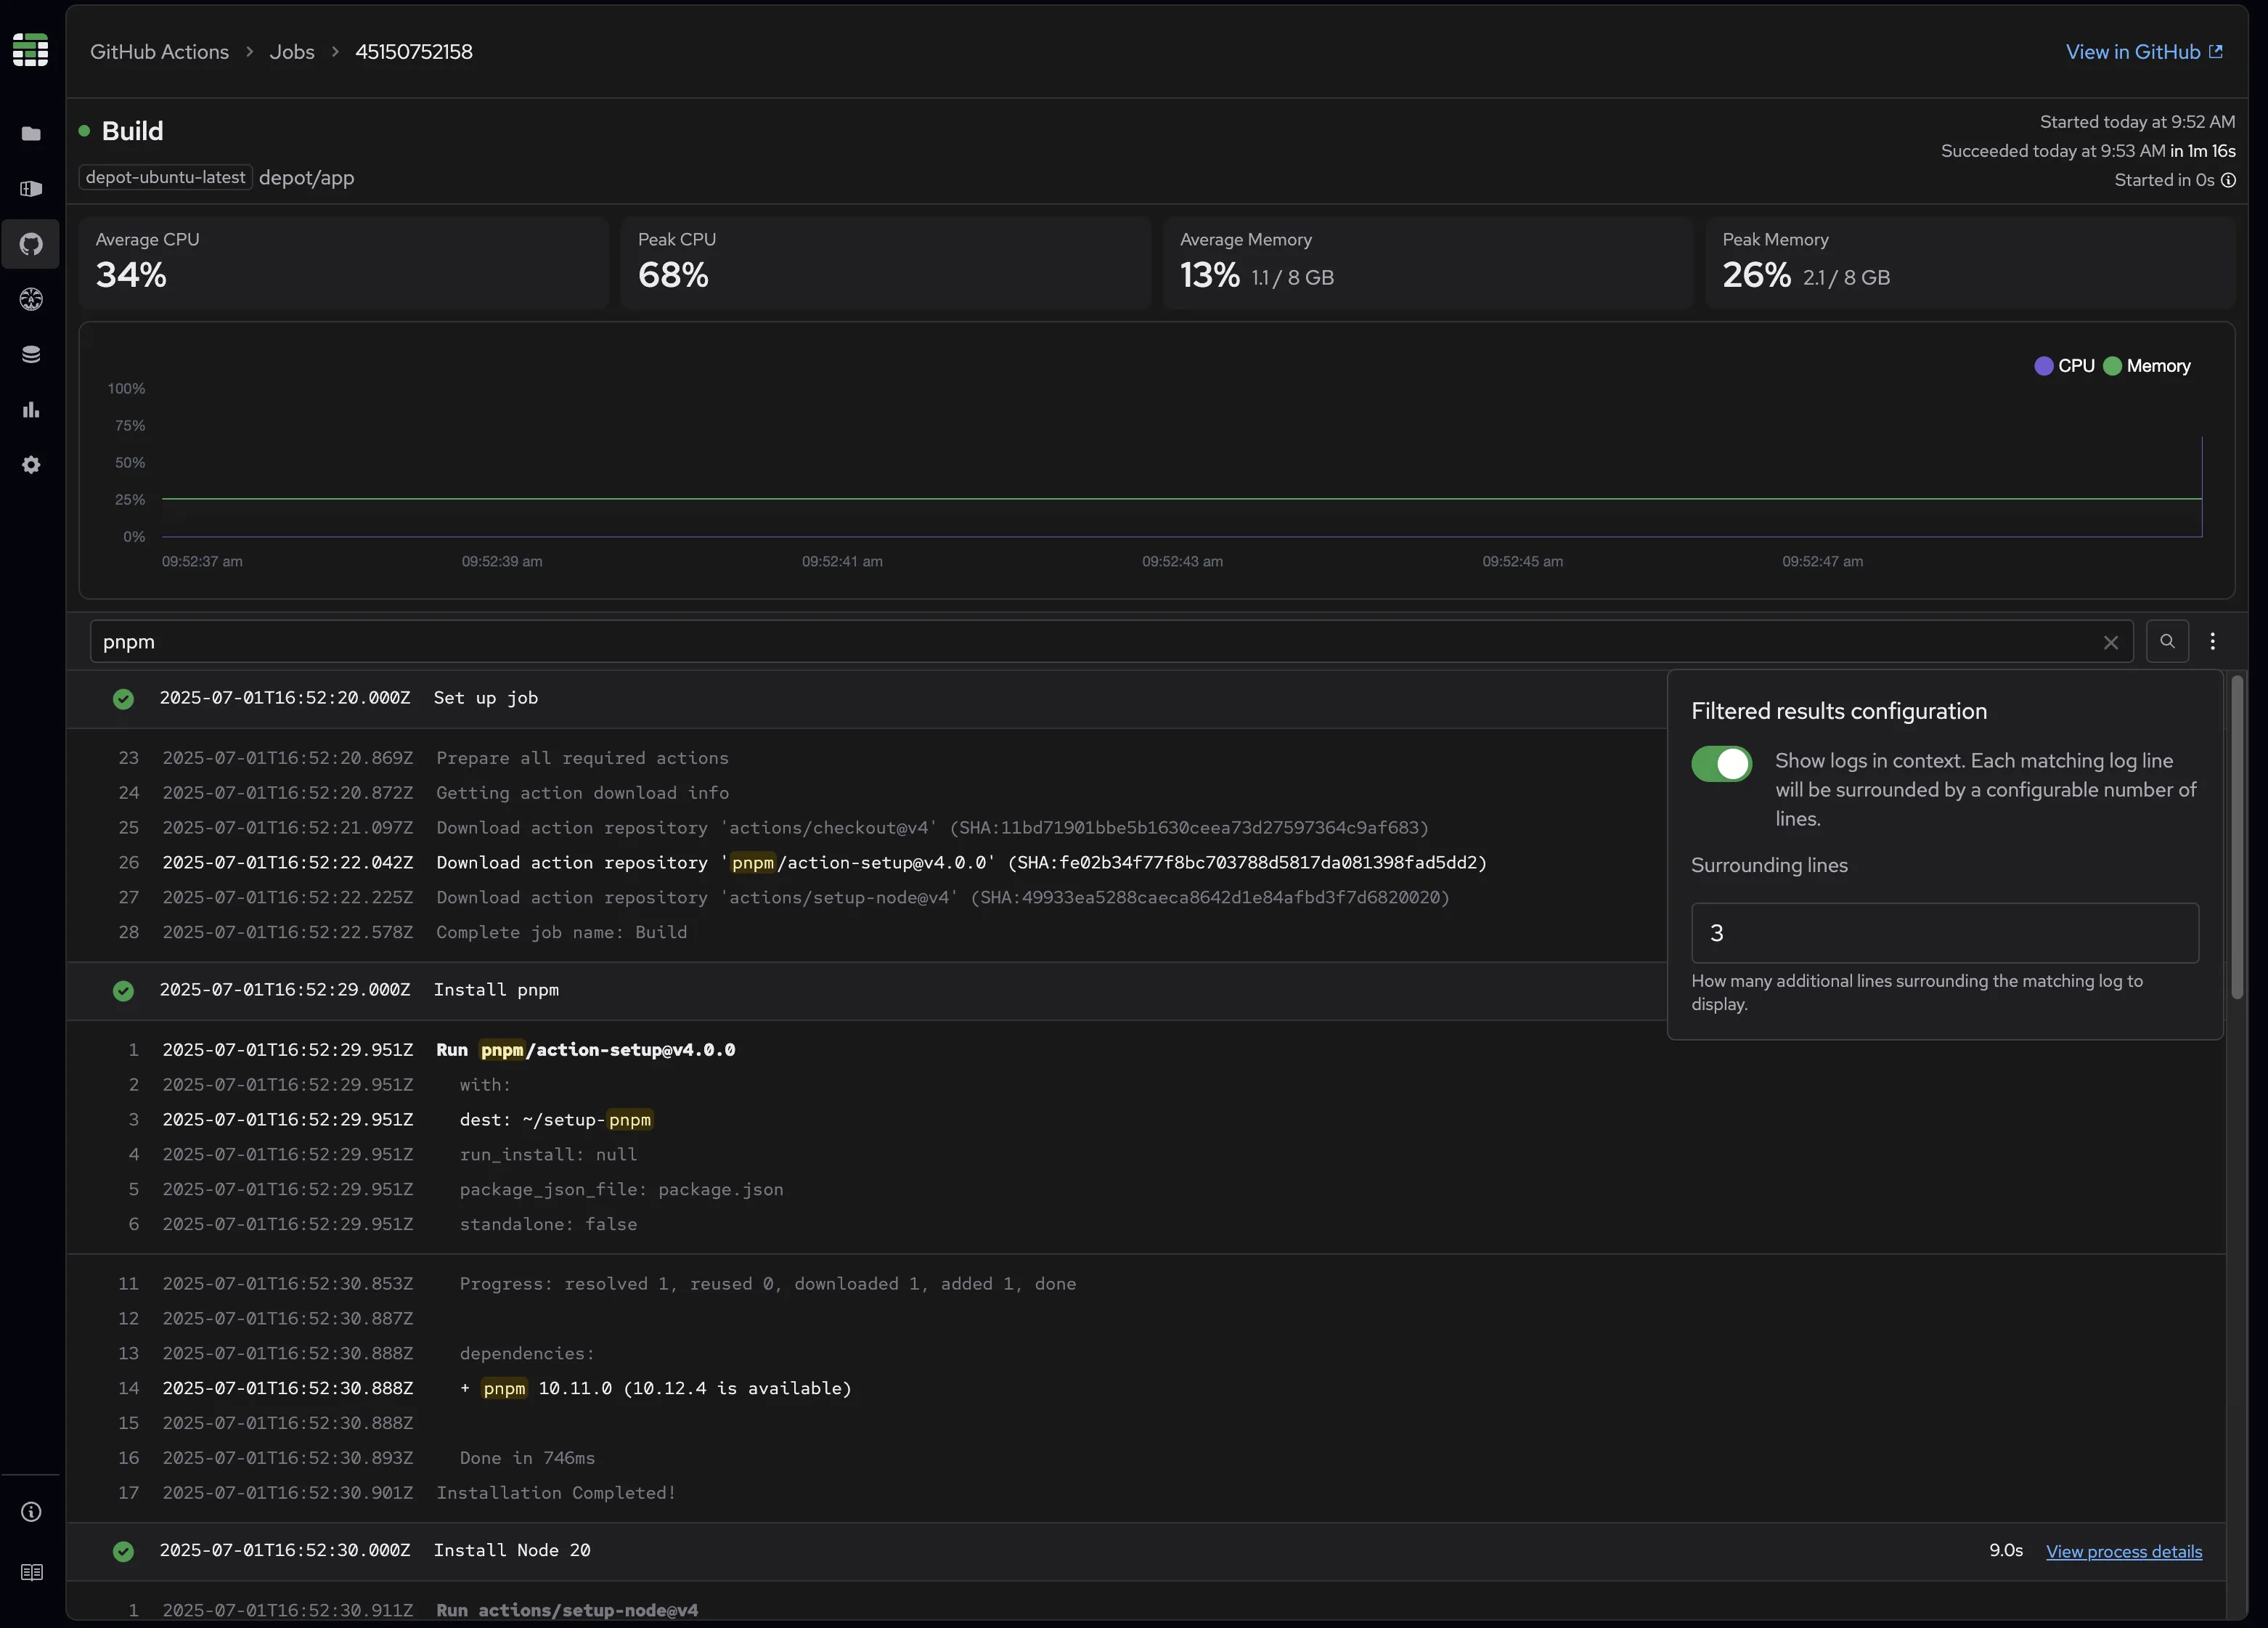
Understanding that job logs make more sense when viewed in context, we provide an "in context" results view that shows surrounding log lines when you search. This configurable feature supports 1-3 surrounding lines, giving you the context needed to understand what led to specific events. When viewing search results in context, selecting any log line takes you back to the complete log view, automatically scrolling to the selected log line within the full context of all logs. Matching text is highlighted to make it easy to identify which logs are relevant to your search.
You can also disable the contextual view if you prefer traditional filtered results that show only matching log lines.
Seamless metrics and logs integration
Memory and CPU metrics graphs help identify what resource utilization looks like at a given time. Job logs and steps help identify what the job is doing at that time. In order to make these even more useful, we've introduced some interactions between them to get a better sense of what is going on at a particular point in time to gain a clearer picture of your job's performance.
- Hover over any metric graph line to see the closest recorded value at that point in time
- Hover over any log entry to see the corresponding timestamp highlighted on the metrics graph, along with the closest recorded metric values
- Hover over any log entry while a step’s process panel is opened to see the corresponding timestamp highlighted on the process metrics graphs, along with the closest recorded metric values
- Hover over any log entry or OOM indicator to see the corresponding timestamp highlighted on the metrics graph, along with the closest recorded metric values
Get started today
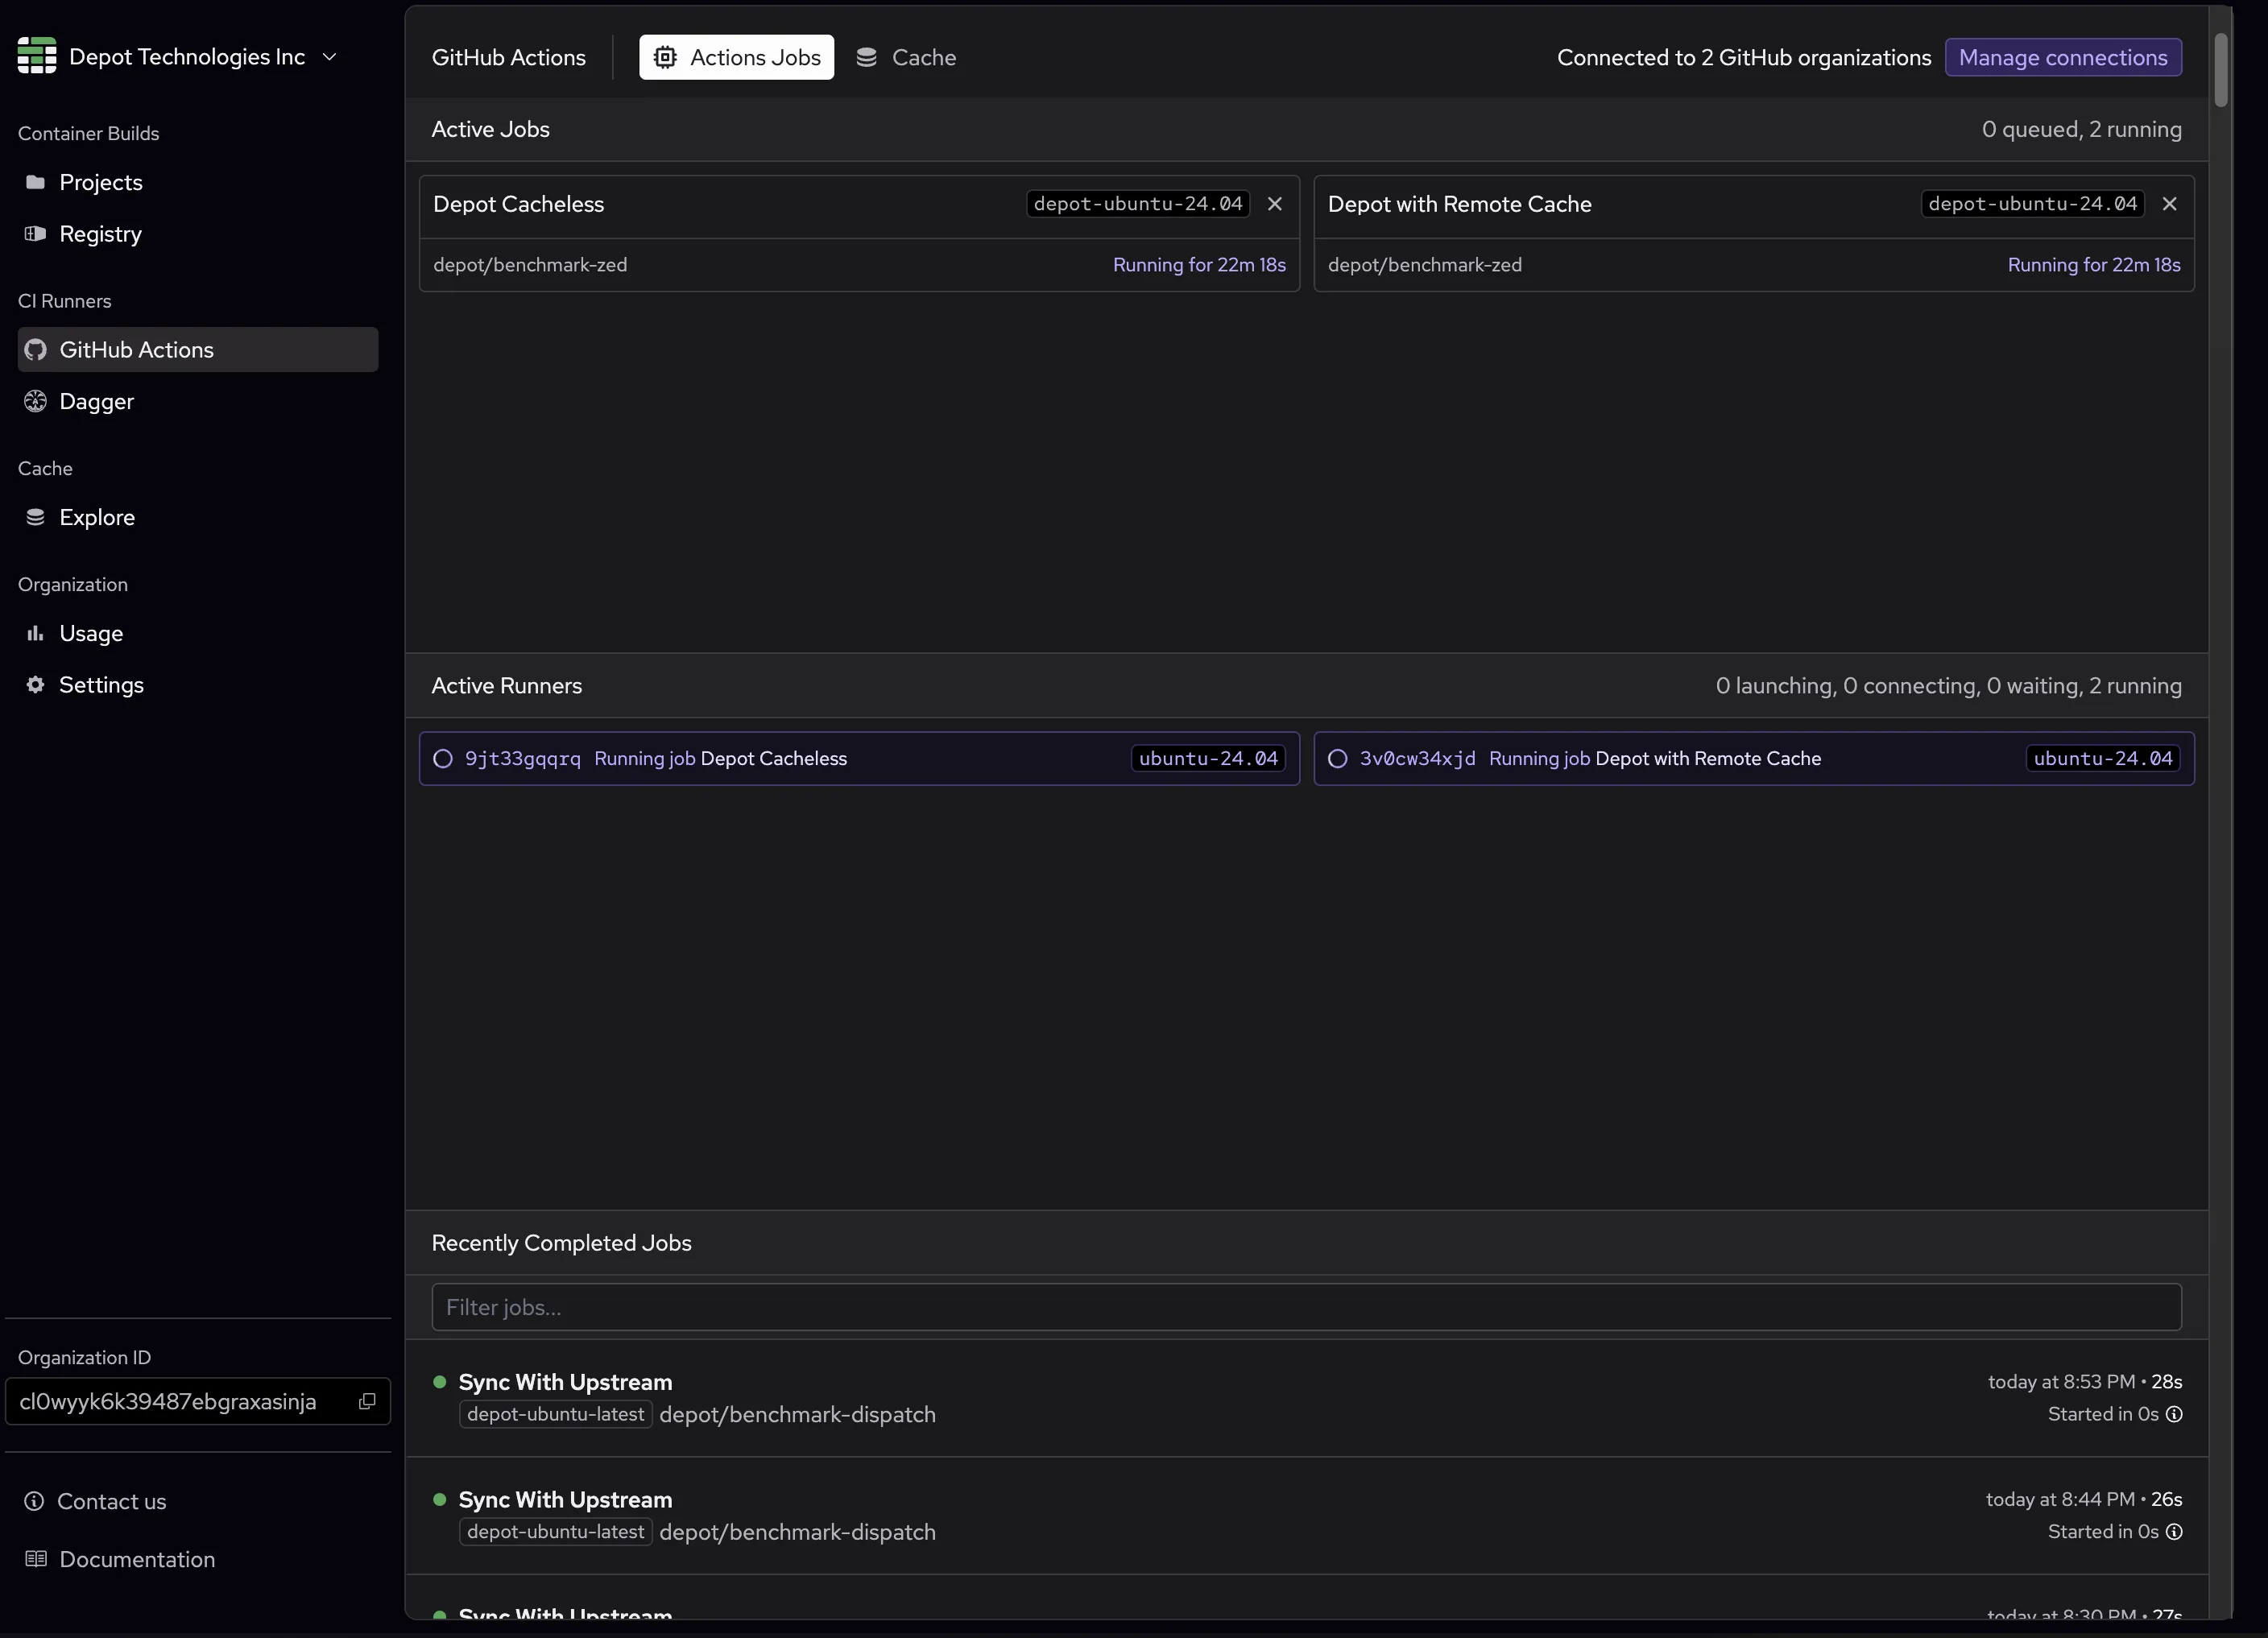
GitHub Job Details are available now in Depot for jobs running on a Depot ubuntu runner. From the existing GitHub Actions page you can now access job details by clicking on any completed or in progress active job.
This release represents our commitment to making CI/CD debugging faster, more intuitive, and more effective. Whether you're troubleshooting a failing build or optimizing job performance, Depot gives you the visibility and context you need to solve problems quickly.
Related posts
- Uncovering Disk I/O Bottlenecks in GitHub Actions
- Comparing GitHub Actions and Depot runners for 2x faster builds
- Observing serverless applications | AWS re:Invent 2024
- How to reduce CI/CD costs: Complete optimization checklist
- Faster GitHub Actions
