
CI bottlenecks have always dragged on team velocity, but agentic coding raised the stakes. When agents write a good chunk of the code, your pipeline runs many more times per day, and every wasted minute gets multiplied across all of those runs. Speeding up your pipelines isn't one heroic refactor. It's a process of finding the next bottleneck, fixing it, and moving on to the next one.
This post walks through the bottleneck most teams hit first: the test suite. The examples come from a project with a Go API, a React dashboard, Postgres and SQLite backends, and a Playwright end-to-end suite. The techniques apply to almost any stack.
Parallel test execution
"Parallel" and "sharded" get used interchangeably, but they mean different things, and the distinction is important.
Parallel testing runs tests across multiple CPUs on a single machine. You scale the tests horizontally by scaling the box vertically: a bigger runner, more workers. This is the most underrated option in CI. It needs no infrastructure, no matrix, and no result merging, yet most suites don't use it fully. It's also the place to start if you have little time to spend on CI work. Checking your worker count takes an afternoon and pays off immediately.
Some suites don't use it at all. Playwright, for example, doesn't run tests in parallel on CI by default. The config that npm init playwright generates contains this line:
export default defineConfig({
  // Opt out of parallel tests on CI.
  workers: process.env.CI ? 1 : undefined,
})As soon as the CI environment variable is set, every test runs one at a time, on exactly the machines where speed matters most. The default exists to keep shared-state tests from flaking: two tests that touch the same database row, the same signed-in user, or the same file can step on each other when they run simultaneously. Tests that don't share mutable state, each setting up its own data and not depending on what other tests leave behind, are isolated, and isolated tests can safely run with as many workers as the machine has cores:
workers: process.env.CI ? '100%' : undefined,A similar pattern hides elsewhere. go test ./... runs packages in parallel, but tests inside a package run serially unless they opt in with t.Parallel(). A serial suite on a 16-core runner leaves fifteen cores idle.
How do you know if you’re using the right size machine? On Depot, every job gets a resource graph:
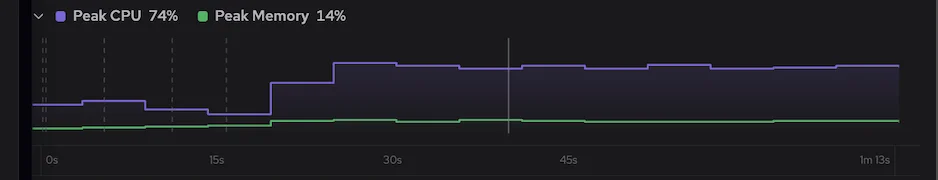
This job peaks at 74% CPU and 14% memory. That's a healthy picture: the CPU is busy and memory has headroom. If the graph showed 30% CPU, the fix would be more workers, not a bigger runner and not more machines. If CPU sits at 100% while tests slow down, the runner is too small for the worker count. Tune workers and runner size against the graph until the machine is saturated. You pay for the whole machine, not for the part you use.
Sharded test execution
Parallelism has a ceiling. A single machine only gets so big, and many test suites stop scaling with cores long before that, because they bottleneck on a shared database, on I/O, or on a dev server doing all the rendering. Sharded testing breaks through that ceiling. The suite is split into slices, and each slice runs on its own machine, autonomously. Twelve shards means twelve runners, each running a twelfth of the suite and reporting its own result.
Our example project fans its Playwright suite out over a matrix of two database backends times six shards:
dashboard-e2e:
  strategy:
    fail-fast: false
    matrix:
      backend: [postgres, sqlite]
      shard: [1, 2, 3, 4, 5, 6]
  steps:
    # ...
    - name: playwright e2e shard
run: playwright test --shard=${{ matrix.shard }}/6A quick note on how the slices get cut: most frameworks ship built-in sharding, like --shard=3/6 in Playwright and similar flags in Vitest and Jest, and that's all most suites need. If yours doesn't, splitting the file list by name and giving each shard its slice works fine.
The cost math of sharding
Here's the catch. Every CI job pays a setup cost before a single test runs: checkout, language runtimes, dependencies, browsers, service containers, seed data. That cost is fixed per machine, which means sharding multiplies it.
We think about this as job density: the fraction of a job's wall time spent doing the work the job exists for. For a test job that's running tests, for a build job compiling, for a lint job linting. Everything else, like setup, downloads, and cache restores, is overhead you pay for but learn nothing from.
Sharding dilutes density. A single job with 3 minutes of setup and 60 minutes of tests sits at 95% density. Split those same tests across twelve shards and each one runs 5 minutes of tests behind the same 3 minutes of setup. Density drops to 62%. Your wall clock improves, but more than a third of every billed minute is now overhead, and each additional shard makes it worse.
This is why sharding is faster but not automatically cheaper, and why there's a sweet spot. Our rule of thumb:
Shard as wide as you want, as long as every shard stays above roughly 80% job density. Put differently: each shard should spend at least four times as long testing as it does setting up
For a 60-minute suite with 3 minutes of setup, each shard needs at least 12 minutes of tests to stay above the line, so the suite tops out around 5 shards.
Most teams stop here and accept the ceiling. But the overhead that creates the ceiling can be cut. Look at how often each step changes:
- Rarely (every few weeks): language runtimes, browsers, OS packages
- Occasionally (every few days): dependency installs, third-party images
- Every run: your code, your images, the tests themselves
Nothing in the first two buckets needs to run on every shard of every run. Even the last bucket only needs to happen once per run, not once per shard.
Build images once, pull them everywhere
The first fix is usually the most mechanical one: stop building your application images inside every job that needs them. In a naive pipeline the smoke job builds, the e2e shards build, and the scan job builds. The same images, built over and over.
Instead, build once in a dedicated job and save the result to Depot's ephemeral registry:
build-images:
  steps:
    - uses: depot/bake-action@v1
      id: bake
      with:
        files: ./docker-bake.hcl
        save: true
  outputs:
build-id: ${{ steps.bake.outputs.build-id }}The build runs on Depot's remote BuildKit with a persistent cache, so all targets in the bake file build in parallel and unchanged layers are instant. Every downstream job, from the smoke tests to the image scans to all e2e shards, pulls exactly the targets it needs by build ID:
dashboard-e2e:
  needs: build-images
  steps:
    - uses: depot/pull-action@v1
      with:
        build-id: ${{ needs.build-images.outputs.build-id }}
targets: api,dashboardIn our traces, loading the API and dashboard images into a shard takes about 5 seconds. The shard runs docker compose up --no-build, seeds the database, and goes straight to testing. The work that changes every run now happens exactly once per run.
Snapshot the rest into a custom runner image
That leaves the rarely and occasionally buckets: runtimes, package managers, browsers, base images. Depot CI custom images let you bake those into the runner itself. You write a workflow that performs the setup once, nightly or on demand, and ends by snapshotting the sandbox filesystem:
jobs:
  build-image:
    runs-on: depot-ubuntu-latest
    steps:
      - uses: actions/checkout@v4
      - uses: actions/setup-go@v5
        with:
          go-version: ${{ env.GO_VERSION }}
      - uses: actions/setup-node@v4
        with:
          node-version: ${{ env.NODE_VERSION }}
      - run: npm install -g pnpm@${PNPM_VERSION}
      - run: pnpm dlx playwright@${PLAYWRIGHT_VERSION} install --with-deps chromium
      - run: docker pull postgres:16-alpine
      - name: snapshot sandbox
        uses: depot/snapshot-action@v1
        with:
image: ${{ env.SNAPSHOT_IMAGE }}Every test shard then boots from that snapshot instead of a bare Ubuntu image:
dashboard-e2e:
  runs-on:
    size: 2x8
image: <org-id>.registry.depot.dev/ci-base:go1.26-node22-pnpm10.13-pw1.49The shard wakes up with Go, Node, pnpm, Chromium, and the Postgres image already on disk, so the toolchain and browser setup steps disappear from every one of the twelve shards. We'll put numbers on it below.
A convention we like: encode the tool versions in the image tag (go1.26-node22-pnpm10.13-pw1.49). When someone bumps Playwright, the tag changes and nobody has to wonder what's inside the snapshot.
Do you need a merge job at the end?
Twelve shards produce twelve reports, and the obvious next step is a final job that merges them into one. Playwright even ships merge-reports for this. Think twice before adding it. A merge job sits on the critical path: it can only start after the slowest shard finishes, and then it boots another runner and downloads every shard's artifacts before doing anything useful. Unless you have a concrete need for a single merged artifact, like compliance evidence or a tool that demands one report, skip it. The run already fails if any shard fails.
If what you actually want is one place to look at results, you don't need a job for that. The Depot CI test results feature, once configured, picks up the JUnit files from all shards and shows them in union automatically, so you get the merged view without spending the extra minutes.
Before and after
Here is the same e2e shard from our pipeline, traced before and after the changes:
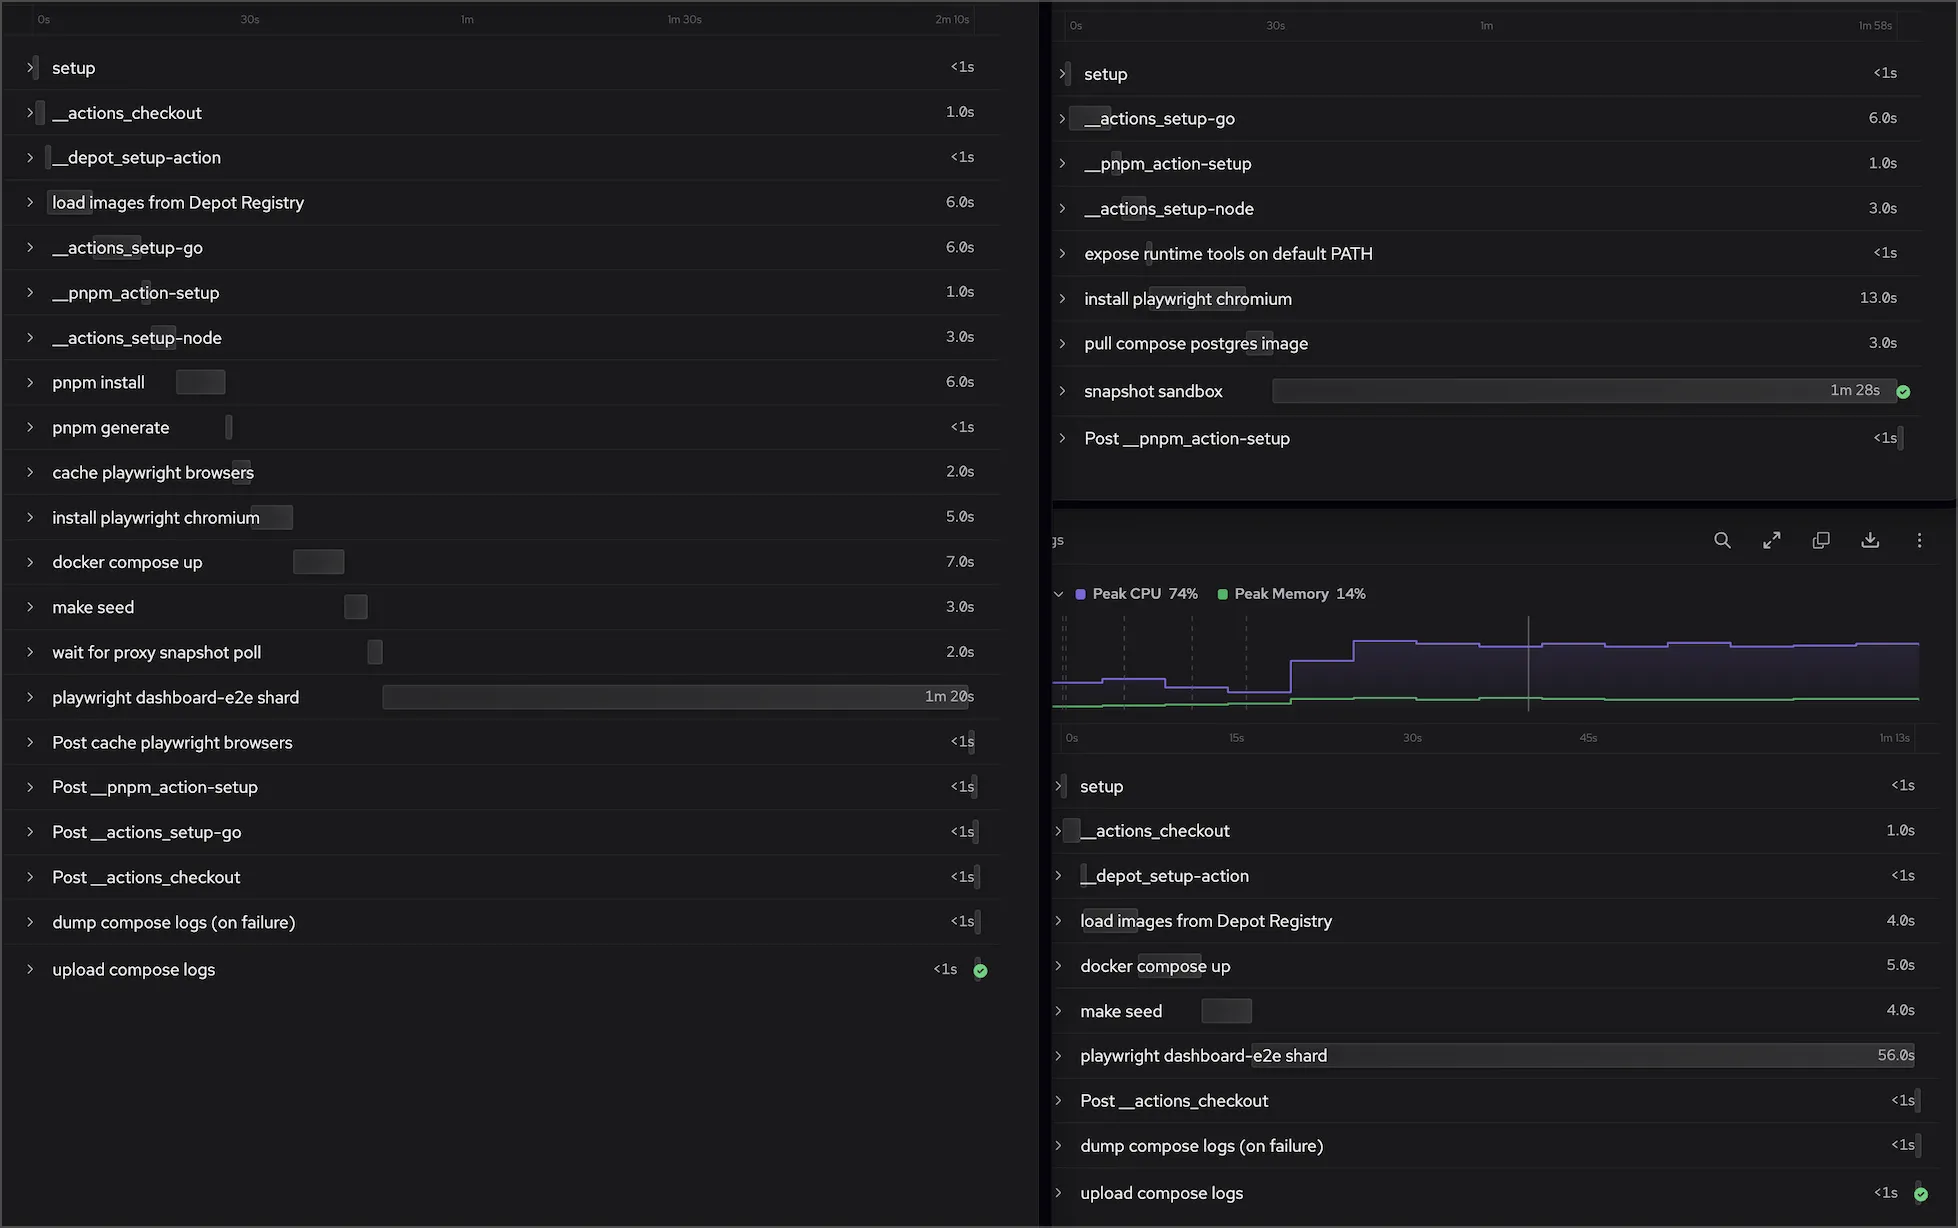
| Per shard | Before | After |
|---|---|---|
| Steps before testing | 14 | 6 |
| Setup time | ~45s | ~15s |
| Total job time | 2m 10s | 1m 13s |
The toolchain steps are gone entirely: no setup Go, no setup Node, no pnpm install, no browser download. The shard boots, pulls the prebuilt images, starts compose, seeds, and tests.
The time saved shows up twice. Each shard starts testing about 30 seconds sooner, and because the e2e stage is only as fast as its slowest shard, the whole stage finishes about a minute earlier on every push, all day long. The cost side is smaller but real: setup runs on every shard, so 30 seconds saved per shard is six minutes of billed runner time per pipeline run that bought you nothing.
Cheaper setup also raises the sharding ceiling from earlier. The 80% rule asks each shard for four times as much test time as setup time: at 45 seconds of setup that's 3 minutes of tests per shard, at 15 seconds it's only one. The same suite can now shard much wider before the overhead starts to hurt.
The order of operations:
- Parallelize within each machine first, and use resource graphs to size workers and runners.
- Shard across machines when one machine stops scaling.
- Build app images once per run, save them, and pull them into every job that needs them.
- Snapshot everything that doesn't change every run into a custom runner image.
Each step raises your job density, and high job density is what keeps sharding profitable. Keep adding shards until the test suite is no longer your bottleneck, then move on to the next one.
FAQ
Why does Playwright only run one test at a time on CI?
Playwright's generated config sets workers: process.env.CI ? 1 : undefined, so the moment the CI variable is set, every test runs serially. The default exists to stop tests that share mutable state, the same database row, the same signed-in user, or the same file, from flaking when they run simultaneously. If your tests are isolated, each setting up its own data and not depending on what others leave behind, you can safely set workers: '100%' and use every core on the runner.
What is job density and how does sharding affect it?
Job density is the fraction of a job's wall time spent doing the work the job exists for: testing for a test job, compiling for a build job. Everything else, like setup, downloads, and cache restores, is overhead. Sharding dilutes density because every shard repays the same fixed setup cost. A 60-minute suite with 3 minutes of setup sits at 95% density as one job, but split across twelve shards each one runs 5 minutes of tests behind 3 minutes of setup, and density drops to 62%. The rule of thumb is to keep every shard above roughly 80%, which means at least four times as long testing as setting up.
How many shards should I run before it stops being worth it?
Start from the 80% rule: each shard should test at least four times as long as it spends on setup. For a 60-minute suite with 3 minutes of setup, each shard needs at least 12 minutes of tests, so you top out around 5 shards before overhead eats the gains. The lever is setup time, not shard count. Drop setup from 45 seconds to 15 by building images once and snapshotting the toolchain into a custom runner image, and the same suite can shard much wider before it starts to hurt.
How do I keep tests from flaking when I increase the worker count?
Flakiness from more workers almost always traces back to shared mutable state: two tests touching the same database row, the same signed-in user, or the same file at once. Make each test set up its own data and not depend on what other tests leave behind, and it becomes isolated and safe to run in parallel. Once tests are isolated, the right worker count is just a function of how many cores the runner has, which you can read straight off the resource graph.
Related posts
- Speed up CI by running independent steps in parallel
- What we need from CI for agentic engineering
- The bottleneck has shifted from writing code to integrating it
