
At Depot, we’ve invested heavily in observability as a way to identify and remediate systemic issues before they manifest for customers. Tracing has become particularly impactful for us as our suite of products has expanded over time.
We've talked recently about our adoption of Durable Lambdas in Depot CI. Although it's been a powerful architectural primitive for us, it has also come with a bit of an operational learning curve. Here are a handful of papercuts we encountered trying to observe durable Lambda behavior with traces, and what we've done to address them.
Gaps are hidden in plain sight
Customers can trigger Depot CI jobs in a bunch of different ways: a git push to GitHub, merging a PR, commenting on an issue, or even pushing a local git patch directly to our api. Our system is constantly listening for any of these events and correspondingly invokes durable Lambda tasks to orchestrate job execution. Those tasks will sit in a queue until their Lambdas boot, and we need to track this duration to make sure it remains under an acceptable threshold.
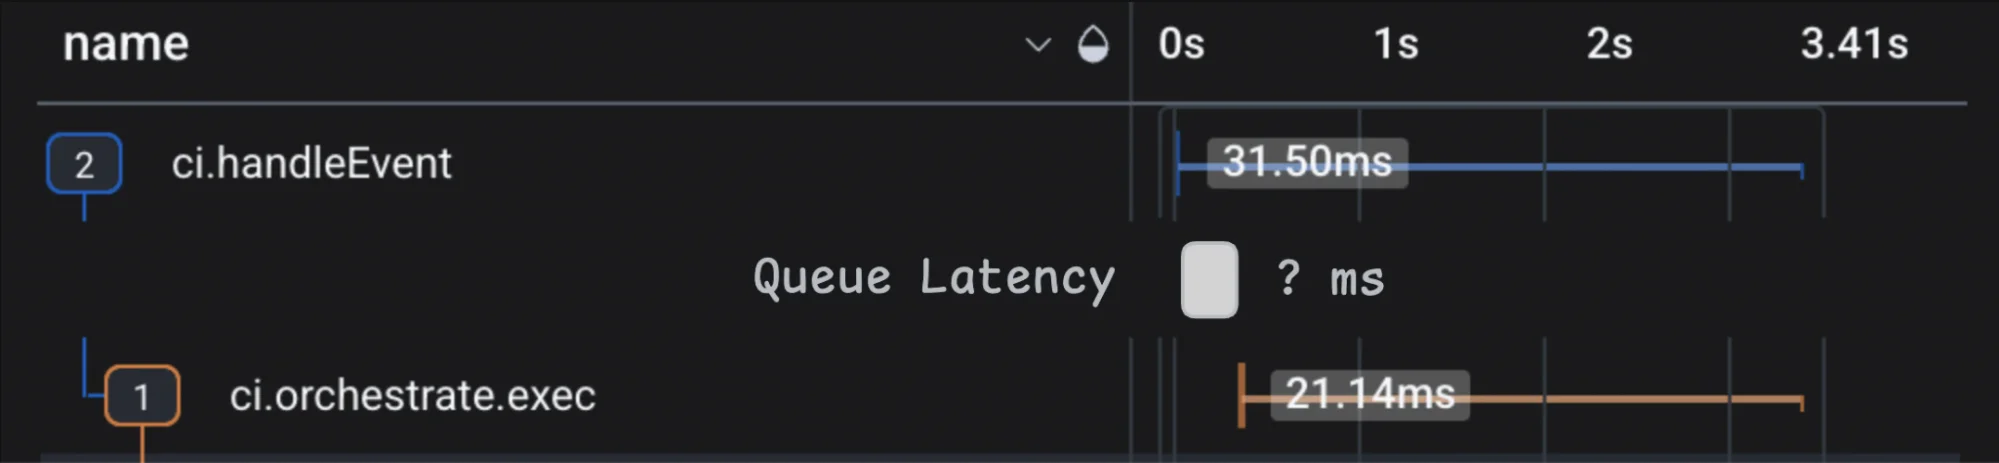
This latency isn't covered by an active span out of the box. We'd need to derive it at query time by comparing timestamps from spans before and after. This would be computationally expensive over a large dataset, and many observability vendors don't support this query shape. Instead, if the Lambda happens to know precisely when it was invoked, we can emit a virtual span immediately after boot.
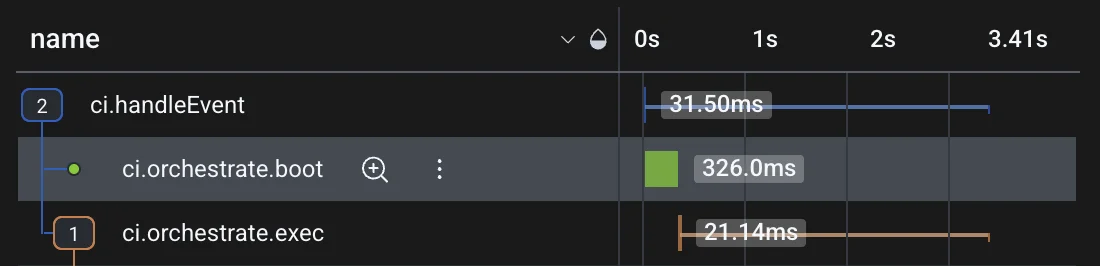
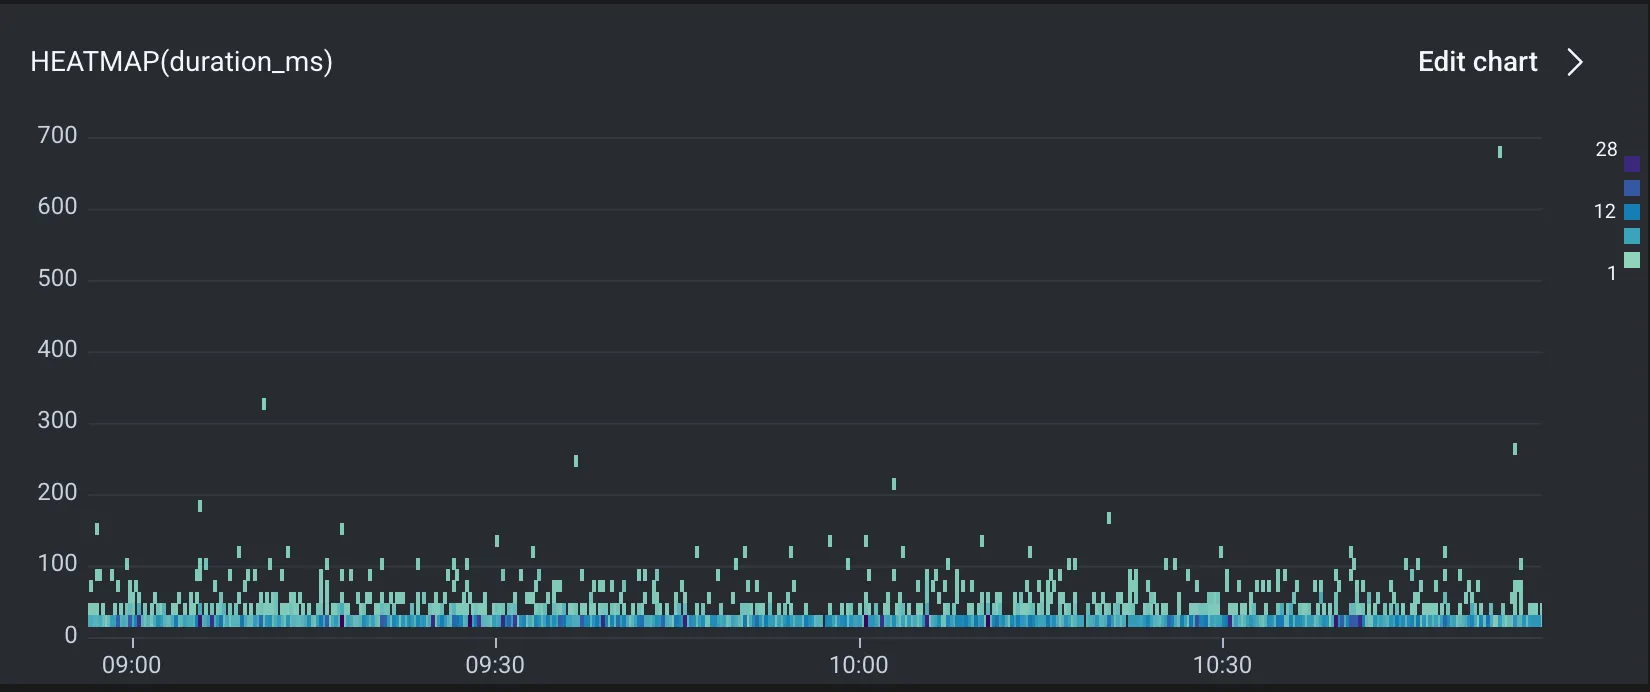
Having this duration captured as a proper span allows us to track it over time and better understand its performance under load. From a heatmap like the following, we can easily identify and review exemplar traces where the Lambda took a long time to boot.
The simplest way to accomplish this is to capture the invocation timestamp directly in the Lambda’s payload. This slots in nicely alongside other tracing metadata like traceid and spanid, each required to tie spans from downstream services into the trace tree. However, as the system grows in complexity, it’s likely that tracing-related metadata will grow in kind. Instead, we can plumb it through opentelemetry’s propagation and baggage apis. This is a bit more effort up front, but the resulting flexibility will be worth it down the road.
const ctx = setBaggage(context.active(), {triggeredAt: Date.now().toString()})

// Populates carrier with {traceparent: {traceid, spanid}, baggage, ...}
const carrier = {}
propagation.inject(ctx, carrier)

await enqueueCIOrchestrate({
  carrier,
  runID,
  orgID,
})Durable Lambdas repeat themselves
A regular Lambda behaves like a script. When it’s invoked, it runs from start to finish and exits with a result. In this context, we can think about spans as we normally would, creating active spans as needed to measure durations for important operations. When those operations complete, their spans are emitted just once before the Lambda terminates.
Durable Lambdas require a different mental model. When we invoke a durable Lambda, we typically expect it to suspend partway through execution, to be continued at some later time. When it wakes, it doesn’t pick up where it left off. It resets the program counter to zero and runs until it’s next suspended.
This presents a problem if your Lambda includes any side effects or performance-intensive work. For instance, you wouldn’t want to email a customer invoice each time the durable Lambda is resumed. You also wouldn’t want to repeatedly create and emit the same span. You can wrap this kind of logic in a durable step, like so:
withDurableExecution(async (payload: Payload, ctx: DurableContext) => {
  // ...
  const usage = await ctx.step('computeCustomerInvoice', () => tableScanForCustomerUsage(payload.customerID))
  await ctx.step('emailCustomerInvoice', () => emailCustomerInvoice(payload.customerID, usage))
  // ...
})Once a step completes, its result is serialized and snapshot before yielding back to the script. All subsequent invocations will use this snapshot in lieu of executing the step again.
This is a perfect seam to cut a new span. When the durable step begins, we create a new active span context. Then the step logic executes and the span is emitted just once for the lifetime of the Lambda.
await ctx.step('emailCustomerInvoice', () => {
  return tracer.startActiveSpan('emailCustomerInvoice', async (span) => {
    try {
      return await emailCustomerInvoice(payload.customerID, usage)
    } catch (err) {
      span.recordException(err instanceof Error ? err : `${err}`)
      span.setStatus({code: SpanStatusCode.ERROR})
      throw err
    } finally {
      span.end()
    }
  })
})Creating spans, emitting them, and capturing exceptions properly amounts to a lot of boilerplate. All of this can be extracted into a helper to condense the code to something more readable:
await durableStepWithSpan(ctx, 'emailCustomerInvoice', async (_span) => emailCustomerInvoice(payload.customerID, usage))Nesting takes a bit of extra work
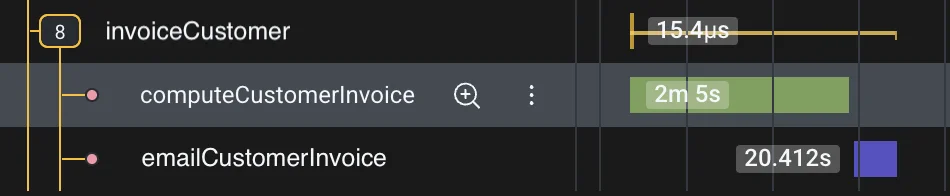
In some cases, you’ll want to group contiguous durable steps together so it’s easier to visually parse the trace tree. It would seem reasonable at first glance to wrap them in a parent span, like so:
await tracer.startActiveSpan('invoiceCustomer', async () => {
  // ...
  const usage = await durableStepWithSpan(ctx, 'computeCustomerInvoice', async (_span) =>
    tableScanForCustomerUsage(payload.customerID),
  )
  await durableStepWithSpan(ctx, 'emailCustomerInvoice', async (_span) =>
    emailCustomerInvoice(payload.customerID, usage),
  )
  // ...
})We’ve now seen why this approach will fail in practice: durable Lambdas suspend and resume. We can expect that invoiceCustomer will be emitted multiple times over the Lambda’s lifetime. Depending on when precisely the Lambda is suspended, earlier durable span children may even be severed from the final trace tree.
Instead, we need to manage the span context manually. Specifically, we can create the parent span context within a dedicated durable step so that it’s snapshot once and reused for all future invocations:
const parentSpanCtx = await emitDurableSpan(durableCtx, 'invoiceCustomer')

const usage = await durableStepWithSpan(durableCtx, parentSpanCtx, 'computeCustomerInvoice', async (_span) =>
  tableScanForCustomerUsage(payload.customerID),
)

await durableStepWithSpan(durableCtx, parentSpanCtx, 'emailCustomerInvoice', async (_span) =>
  emailCustomerInvoice(payload.customerID, usage),
)In this configuration, we create and immediately emit a 0-duration parent span, in order for its context to be serialized and reused. This isn’t perfect, as ideally we’d prefer the parent’s duration to cover that of its children. With a bit more effort, the parent span definition itself could be snapshot, then later recreated and emitted with a proper duration in a closing durable step. But at least now we have a “folder” in which to place child spans and view their activity in isolation.
Visibility restored
In the weeks following Depot CI’s launch, we uncovered all sorts of performance bottlenecks as customers increasingly kicked the tires and migrated their workloads. Having complete traces with accurate span durations helped us monitor critical latencies in load-bearing components like our workflow orchestrator, our polyglot cache service, and our OCI image registry. In many cases, simply visualizing the execution path of a single CI workflow gave us what we needed to tie a support ticket back to its root cause. Whenever we encountered a blindspot, we spent the effort to correct it with high priority.
Everywhere else in our stack we had been able to assume a single linear flow of execution. Durable Lambdas are inherently replayable and have thus required a bit of extra effort to instrument properly. With the techniques described above, we’ve been able to restore the end-to-end visibility that we enjoy for the rest of our system. And the payoff has been worth it.
FAQ
Why do durable Lambdas emit the same span more than once?
Because a durable Lambda resets the program counter to zero each time it resumes. It replays from the top, so any span you create outside a durable step gets recreated and emitted on every invocation. Wrap the span creation in a durable step instead: the result is snapshot once and reused, so the span is emitted just once for the Lambda’s lifetime.
How do you trace the time a task spends queued before its Lambda boots?
That latency isn’t covered by an active span out of the box, and deriving it at query time by diffing timestamps from neighboring spans is expensive over a large dataset and unsupported by many vendors. Instead, carry the invocation timestamp into the Lambda (in the payload, or through OpenTelemetry baggage) and emit a virtual span immediately after boot that runs from the trigger time to now.
Why use OpenTelemetry baggage instead of just putting the timestamp in the payload?
Stuffing the timestamp directly into the payload works fine on day one. But tracing metadata tends to multiply as the system grows: traceid, spanid, and whatever comes next. Baggage and propagation give you one flexible channel to carry all of it instead of widening every payload by hand each time. It’s more setup up front and less churn later.
Can the parent span’s duration actually cover its children?
The simple version emits a 0-duration parent span purely so its context can be serialized and reused, which means it doesn’t wrap its children in time. If you want a real duration, snapshot the parent span definition itself, then recreate and emit it with proper start and end timestamps in a closing durable step. It’s more work, but you end up with a parent whose duration spans its children.
Related posts
- Building Depot CI with Lambda durable functions
- Lambda durable functions: Real implementation notes
- We instrumented GitHub Actions. Here's what GitHub won't show you.
