As applications become more complex and distributed architectures more common, observability becomes increasingly challenging. Boris Tane, founder of Baselime (now part of Cloudflare), and Kyle Galbraith, CEO of Depot, discuss the challenges of observing serverless applications and how high-cardinality metrics and observability tools can help.
This post is a recap of "Observing serverless applications (SVS212)" from AWS re:Invent 2024.
Why observing serverless applications is hard
Many of the long-standing practices for observing applications are based around the assumption of a monolithic architecture within a single provider. As applications become more distributed and contain more components, we need to rethink how we observe our applications as a whole.
The three pillars of observability
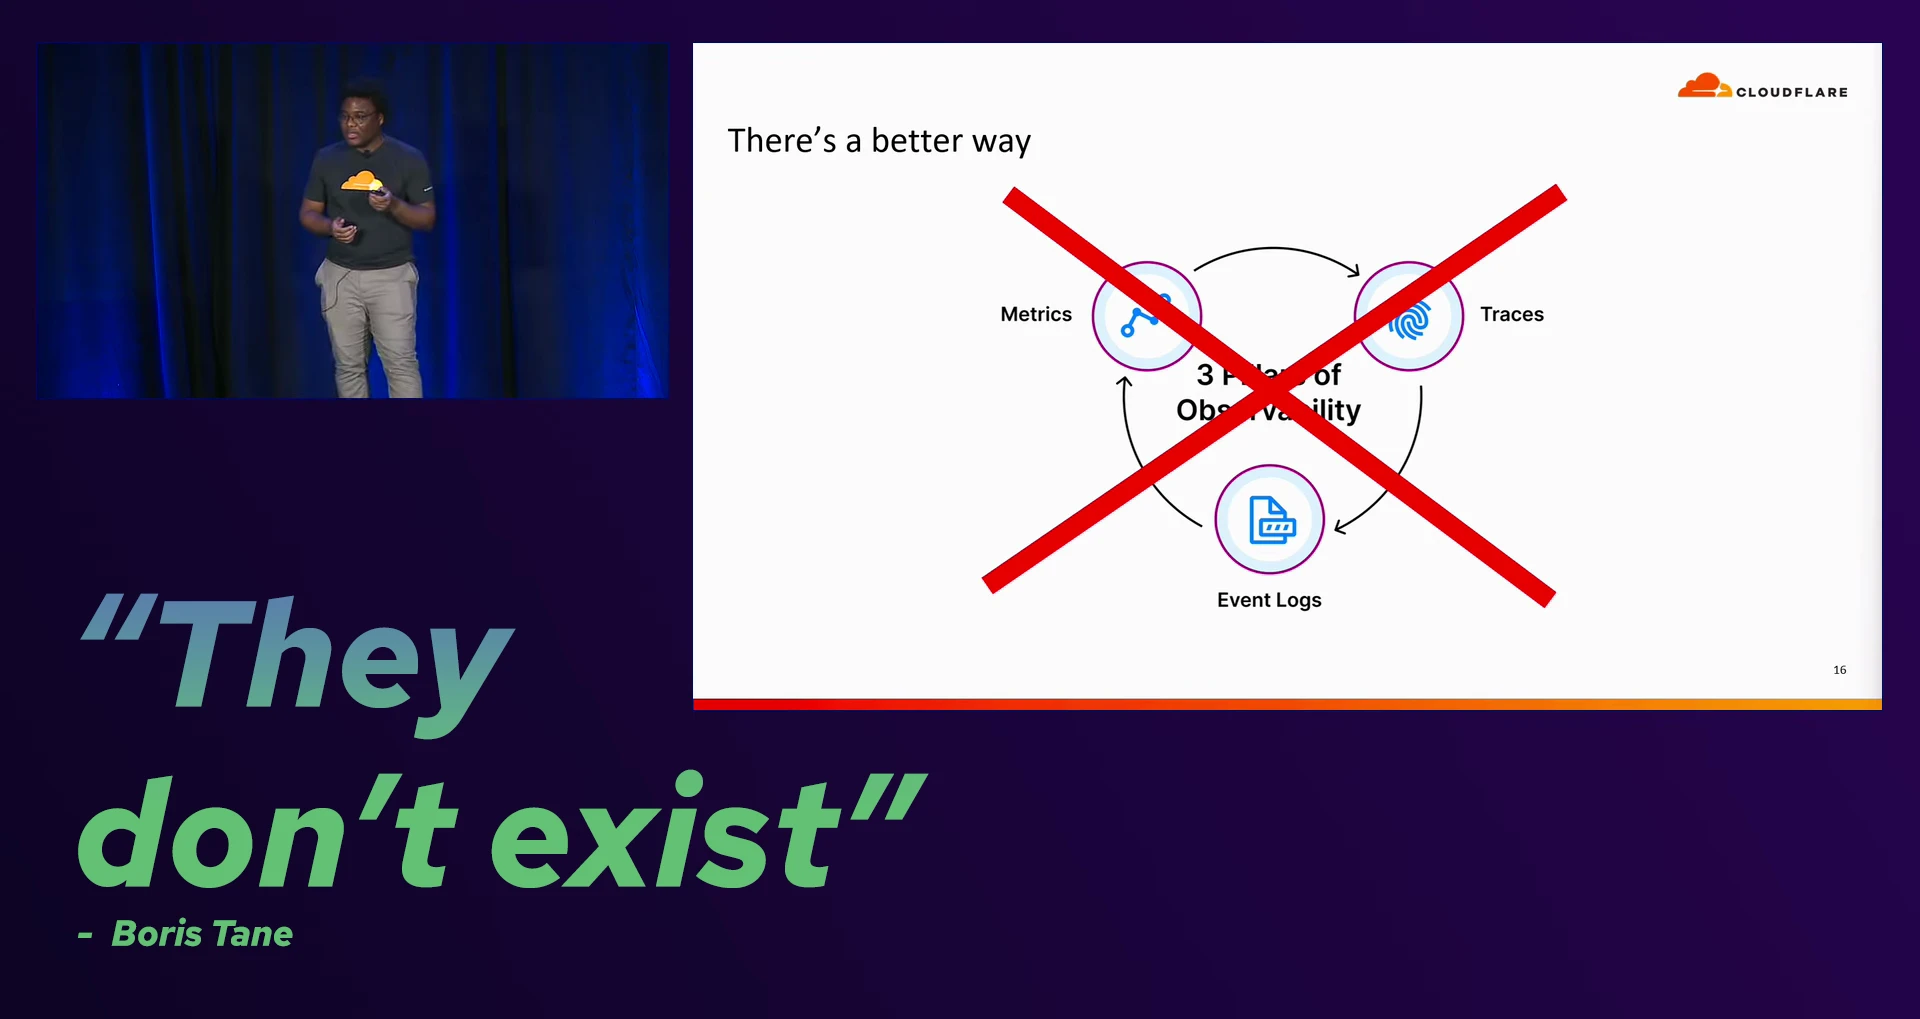
Boris shares the "myth" of the three pillars of observability: metrics, event logs, and distributed tracing. While these are important, they aren't sufficient for observing distributed serverless applications effectively.
Event Logs
When observing logs through CloudWatch or other similar services, each log line is a single event from a single source, like a Lambda function. On their own, individual logs are not very useful for identifying emerging issues or trends. You are typically limited to text-based searches, or at best some basic JSON parsing. What is missing from basic log search is the ability to correlate logs across multiple sources and mapping them to our application's architecture, which would give us a better view of the system as a whole.
Metrics
Traditional metric dashboards are often focused on reporting the health of a system, but are not usually focused on aiding in identifying the root causes of the issues they are reporting. They can let us know we have a problem, and from previous experience we may have a hypothesis of what the problem is, but without correlation between metrics, logs, and traces, we are left to guess.
Distributed tracing
Tools like AWS X-Ray or OpenTelemetry are better suited to identifying issues than logs and metrics, as they trace the flow of requests through your system and break down the time spent in each part of the system. Where traces can fall short is in determining whether a particular trace is an outlier, or if it's part of a larger trend.
High-cardinality metrics: the key to observability
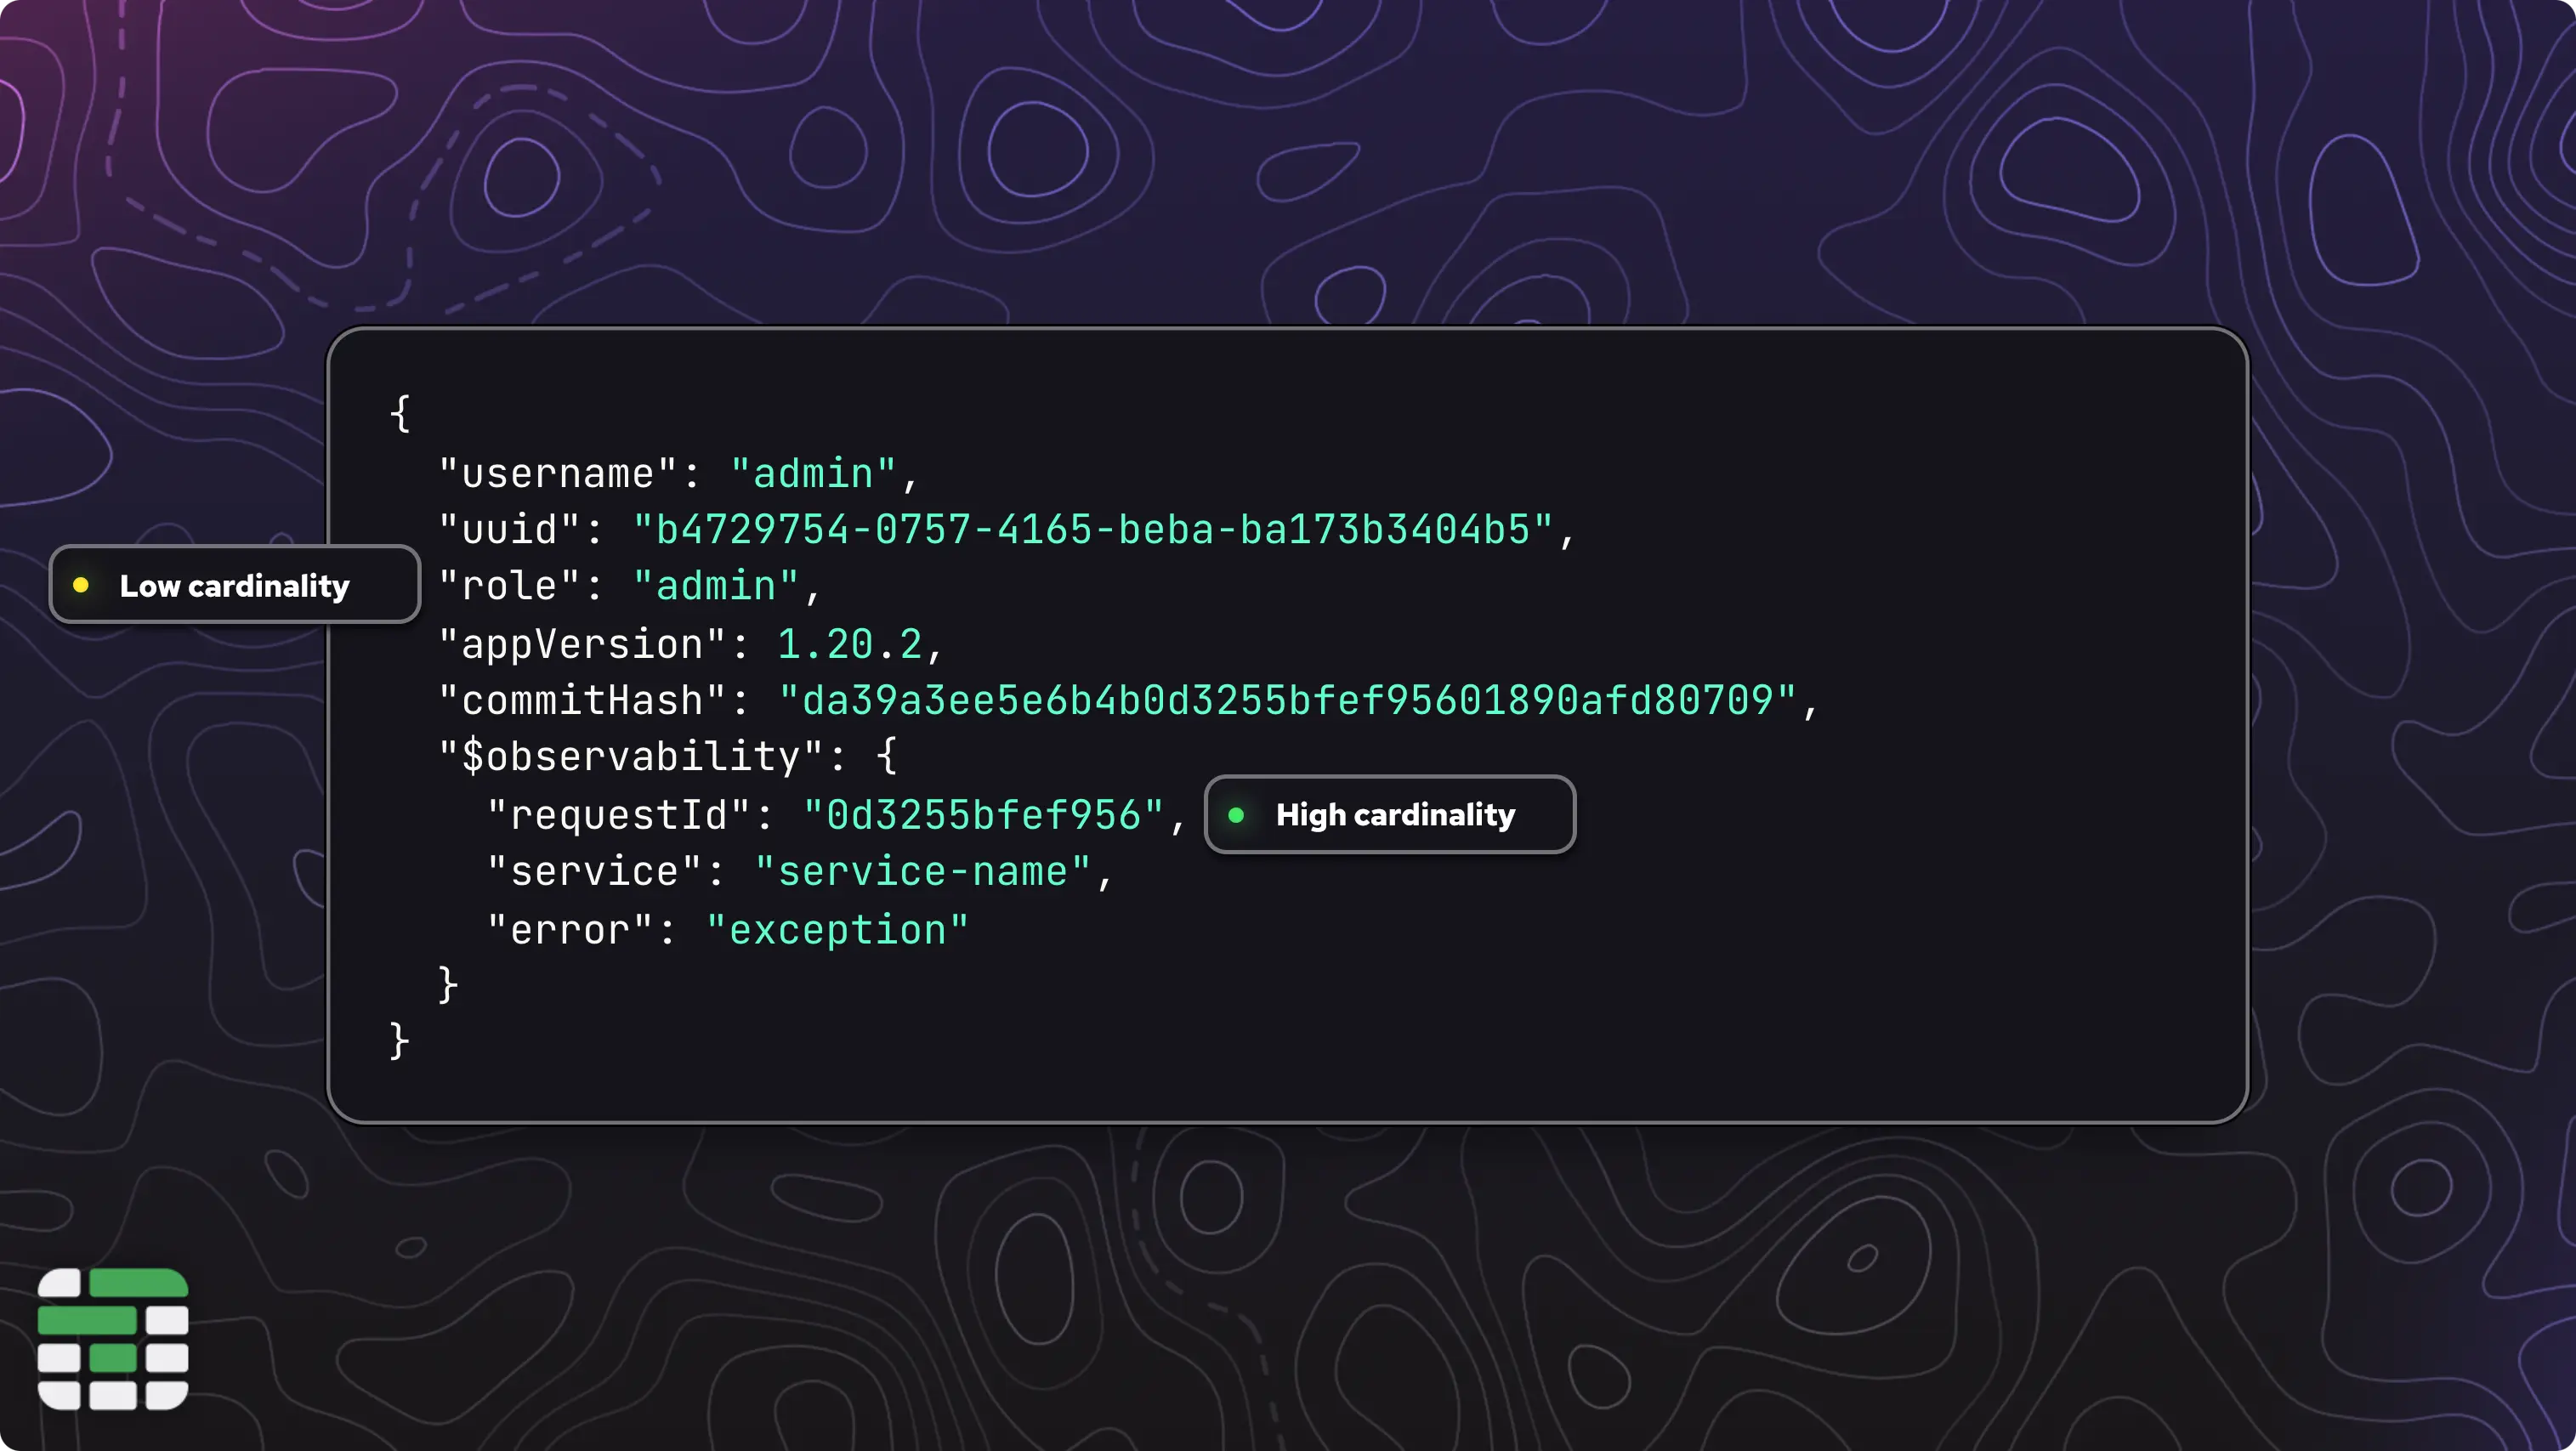
Boris goes on to introduce the importance of data cardinality in observability. He explains that high-cardinality is synonymous with the uniqueness of the data. For example, a request ID is unique to each request and will never be repeated, making it a high-cardinality field.
There is also high-dimensionality, which relates to the number of unique fields in a dataset, or the maximum number of columns that could exist in a table.
You want a mix of both high-cardinality and high-dimensionality data in your metrics, as this will give you the most flexibility in querying and correlating your data.
Utilizing high-cardinality metrics with observability tools
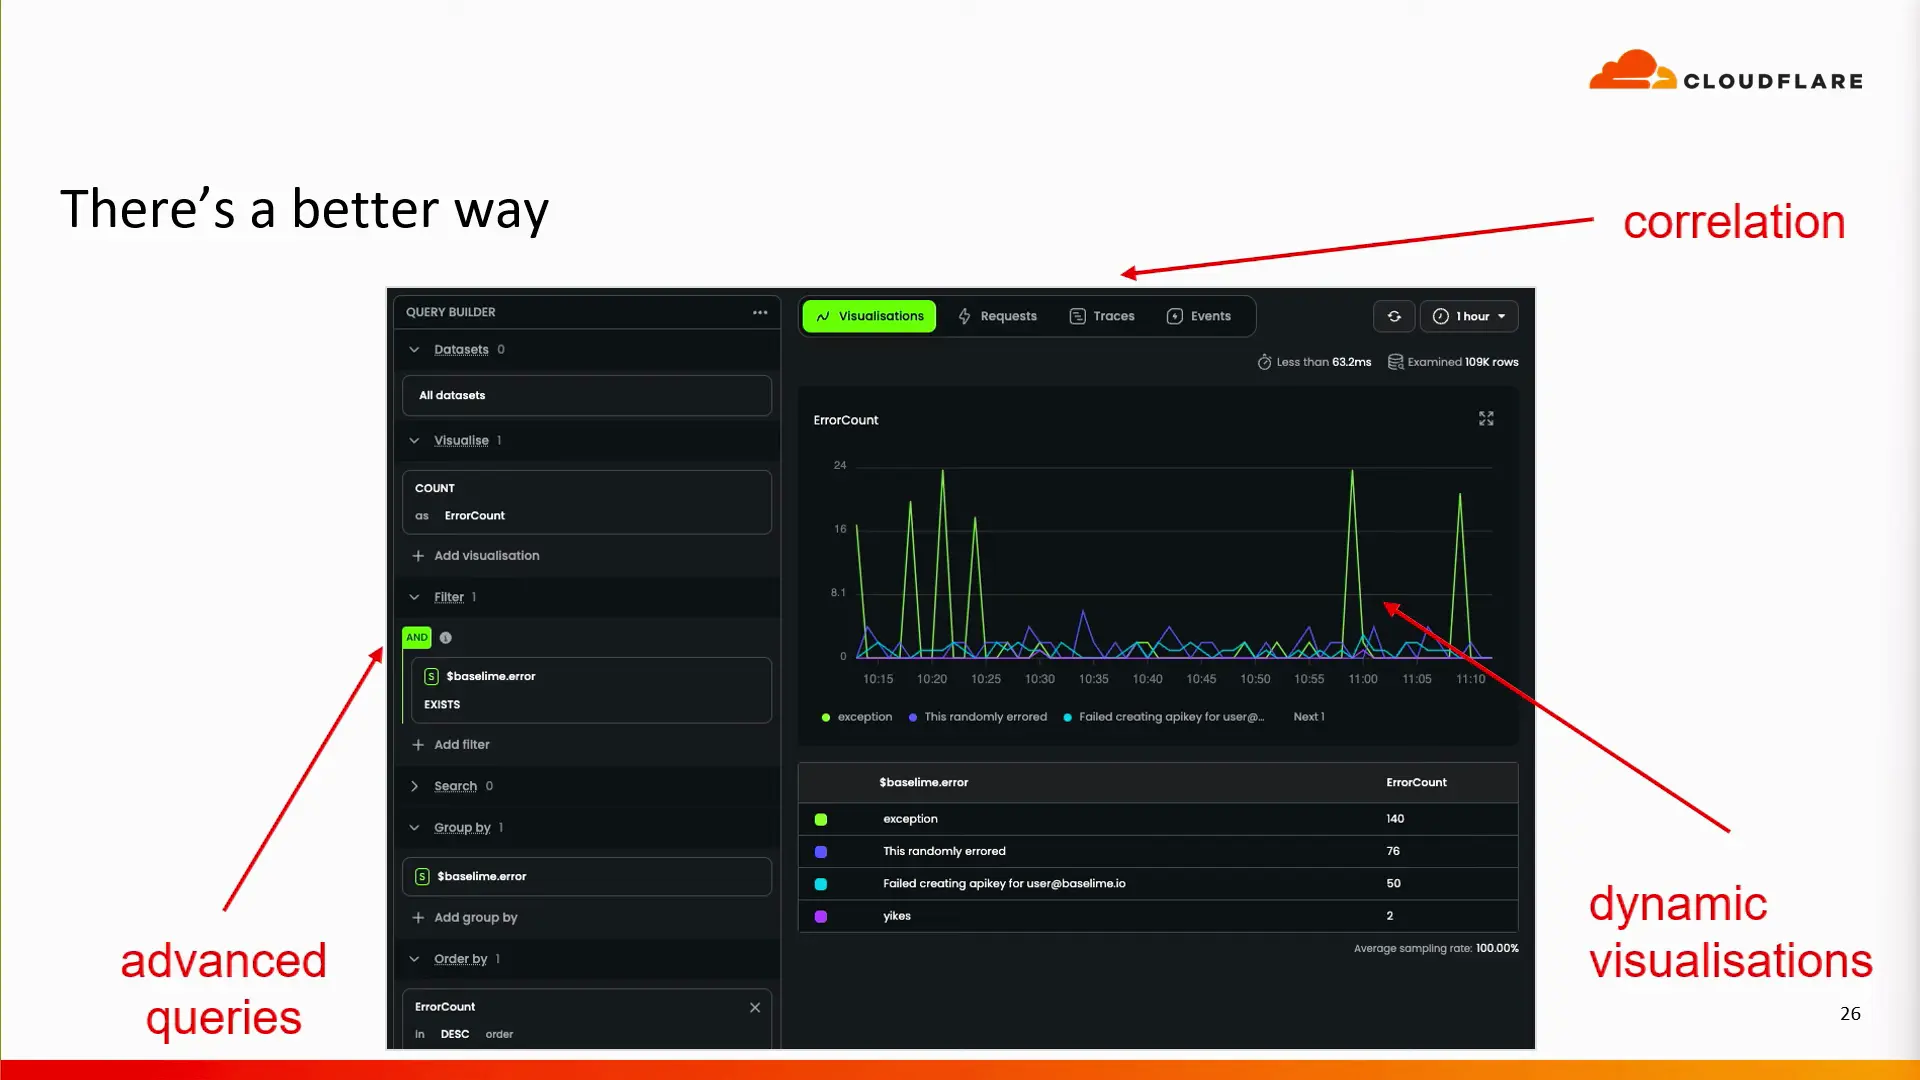
With high-cardinality / high-dimensionality metrics, and a capable observability tool, you can begin to craft more advanced queries which can better assist in identifying the root cause of issues in your serverless applications.
Boris suggests including information such as the git commit hash and versioning numbers in all of your metrics, so you can correlate a high rate of errors with a specific change in your application.
Native observability coming to Cloudflare
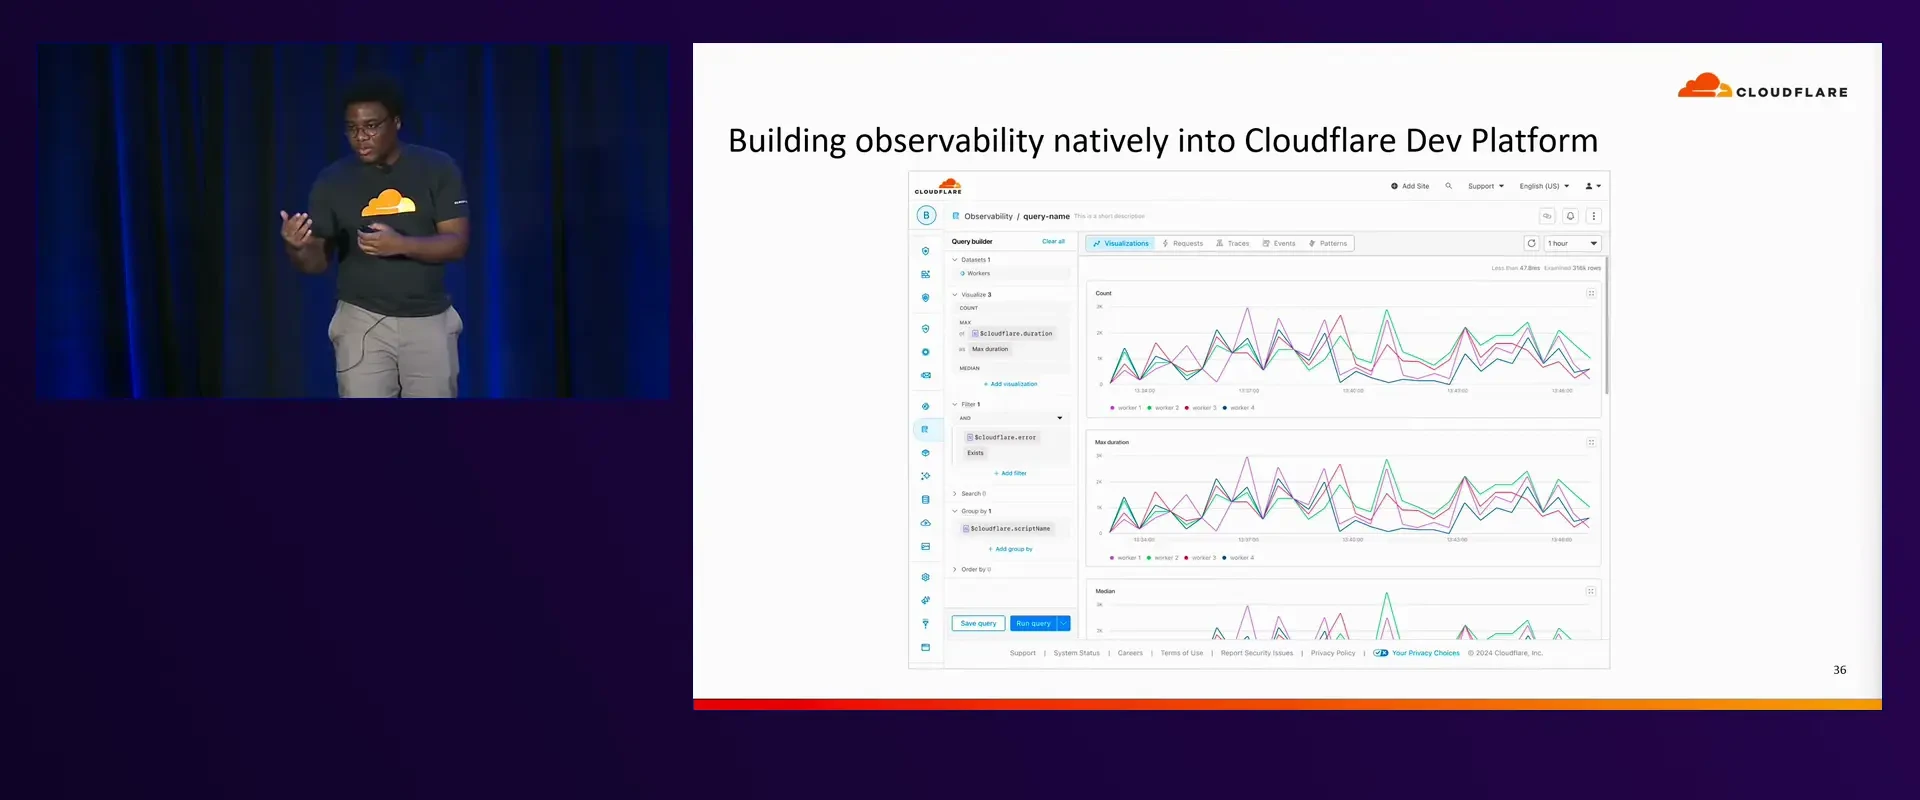
Since Baselime joined Cloudflare, Boris has been working on building observability natively into the Cloudflare platform.
Boris shares how he and the team at Cloudflare are working to automatically add high-cardinality metrics to all services on the Cloudflare platform. He gives the example of where your application might have a legacy style console.log statement with something like console.log('user completed purchase'); Cloudflare can automatically add high-cardinality data alongside this log, such as HTTP headers, the trigger, source, and more.
How Depot uses observability to reduce build times
Kyle from Depot takes the stage to showcase a high-level architectural overview of Depot's serverless components and how we integrate with observability tools like Baselime to reduce build times for our users.
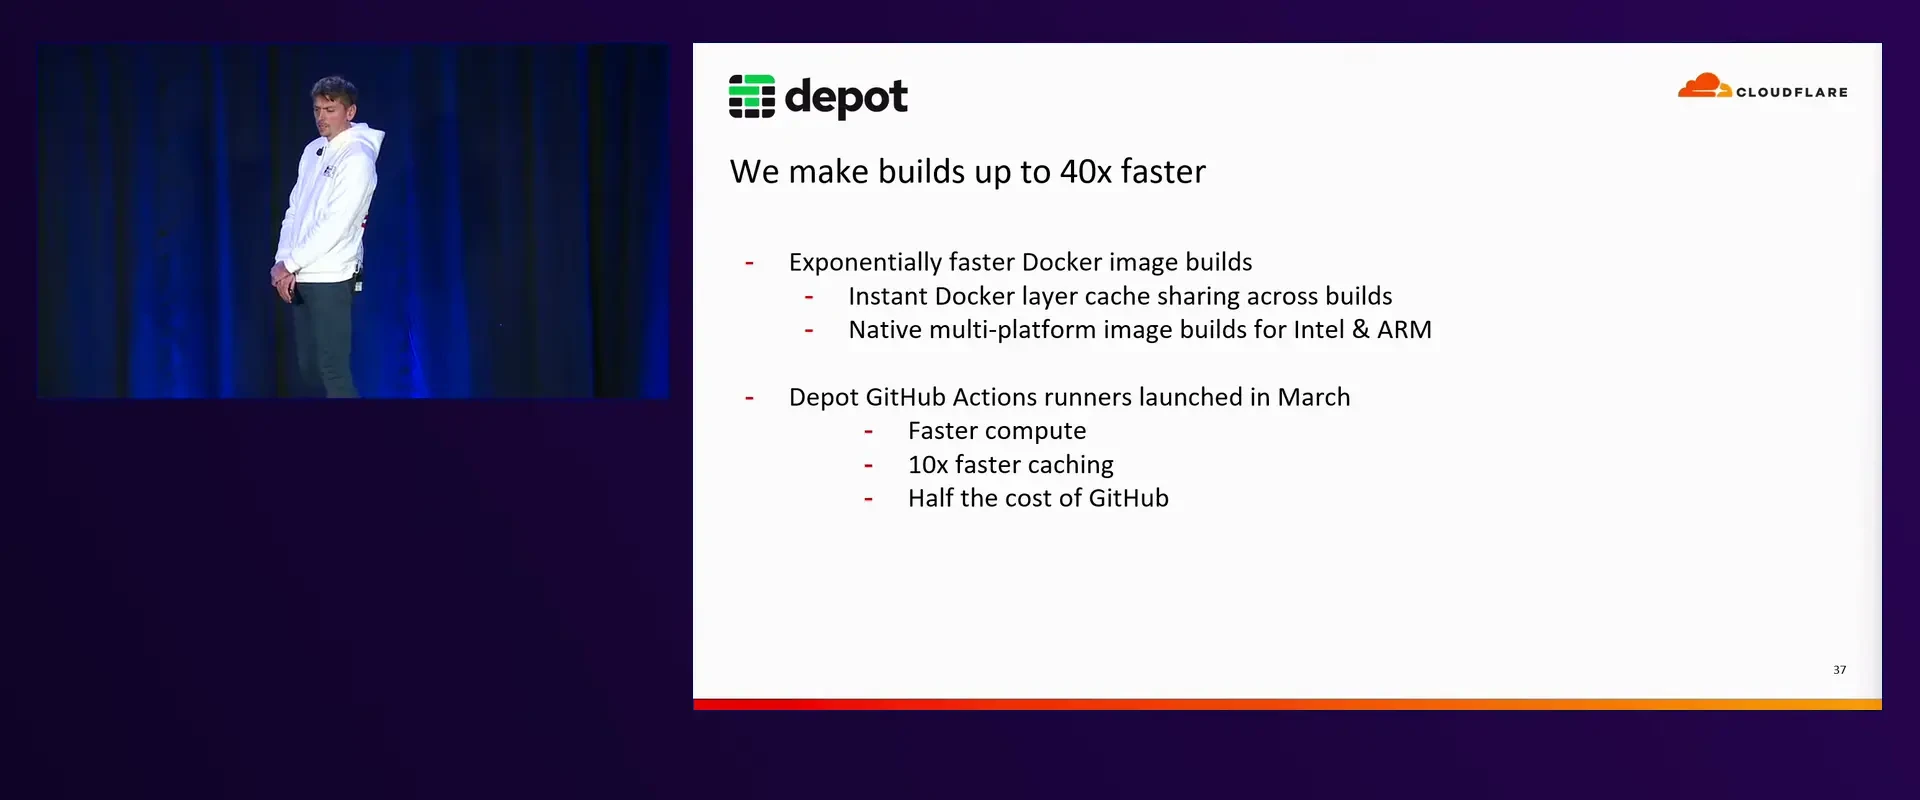
Depot is a build-acceleration platform focused on two key areas: remote container builds and managed GitHub Actions runners. With features like instant shared layer caching, native multi-platform support for Intel and ARM, and a suite of other optimizations, Depot accelerates builds by up to 40x. On top of performance optimizations, Depot also offers enhanced Docker build insights, making it easier for developers to debug and optimize their builds.
Depot’s GitHub Actions runners extend these benefits to CI/CD pipelines. Powered by optimized Amazon EC2 instances, they're designed to boot quickly, deliver faster compute performance than GitHub’s native runners, and enable 10x faster caching — all at half the cost of GitHub.
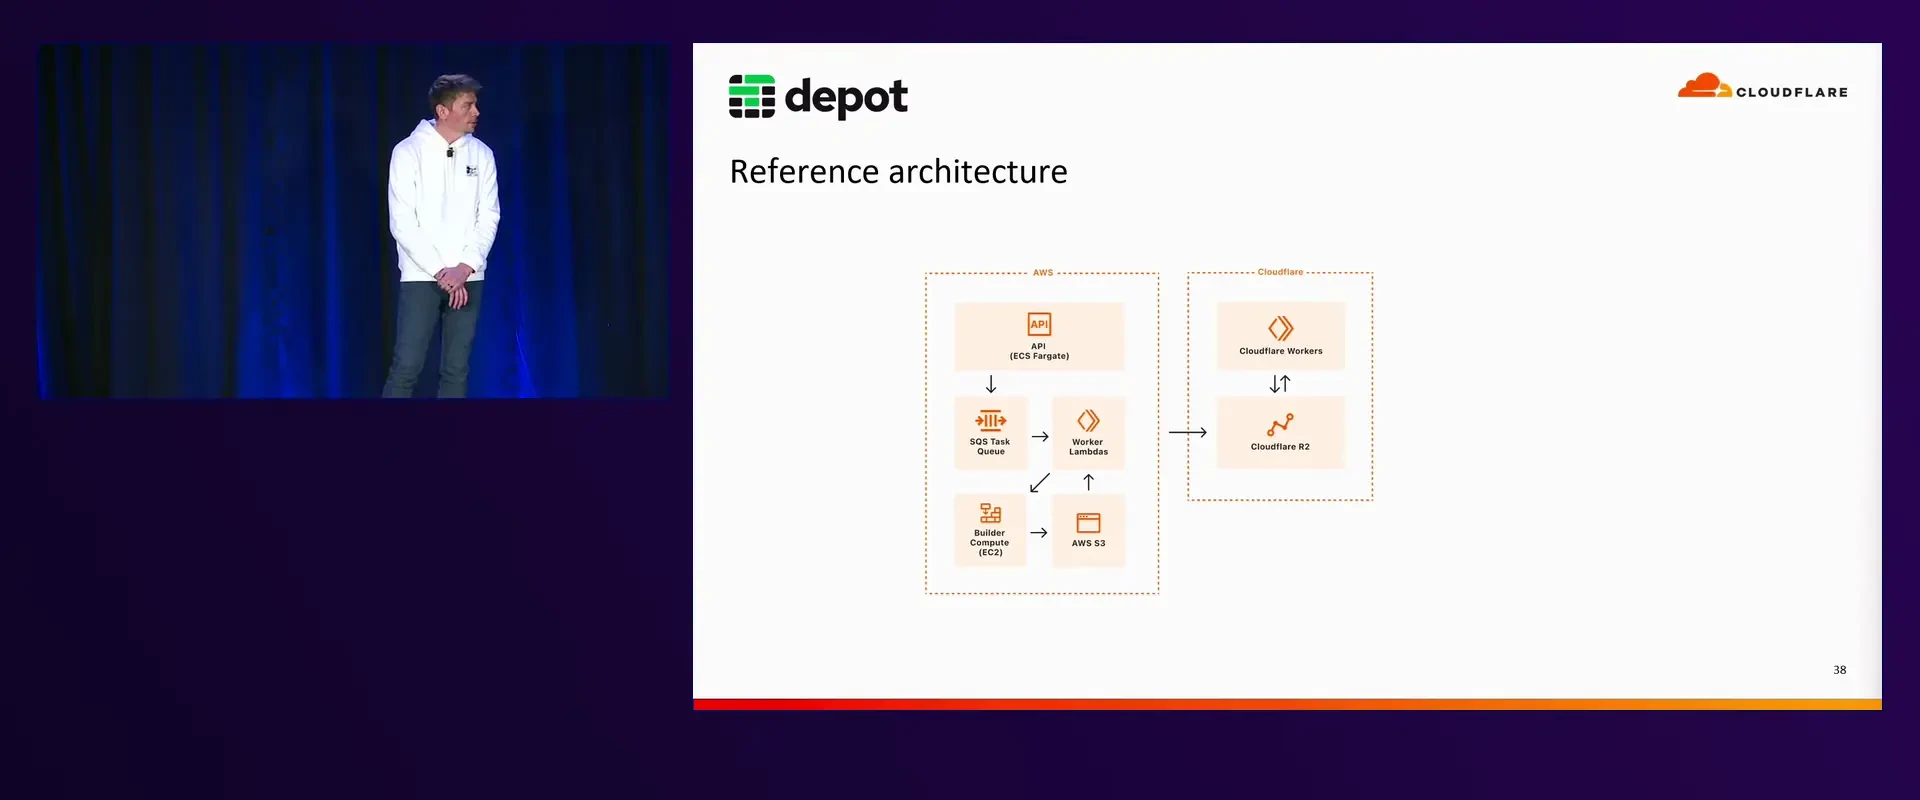
Offering this level of performance and speed is not as simple as throwing more compute at the problem. Kyle goes on to give an overview of the basic architecture responsible for providing compute and storage to our users.
A new request for compute comes in through the control plane (ECS Fargate), and is entered into the SQS queue. Lambdas read messages off the SQS queue and perform a task based on the type of event, such as launching new EC2 instances, stopping instances, moving instances from "warm" to "active", or killing instances when builds are terminated.
The build compute comes from EC2 instances, which run an agent that communicates with the orchestration process (Lambdas). The instances listen in for instructions on whether or not to become a GitHub Actions jobs, or a remote container build.
On the Cloudflare side, Depot is using R2 storage with Cloudflare Workers to serve a container registry. Behind CloudFront, a Lambda@Edge function detects if a request for an image on the registry is coming from inside AWS, or somewhere else. If the request is coming from inside AWS (such as from our builders), the image is served from S3. Inside the AWS network, the latency to S3 is fast, and there is less concern about egress costs. When dealing with requests outside the AWS network, such as from users' local machines, the request is redirected to Cloudflare and served from the R2 storage.
How Depot spots a bottleneck
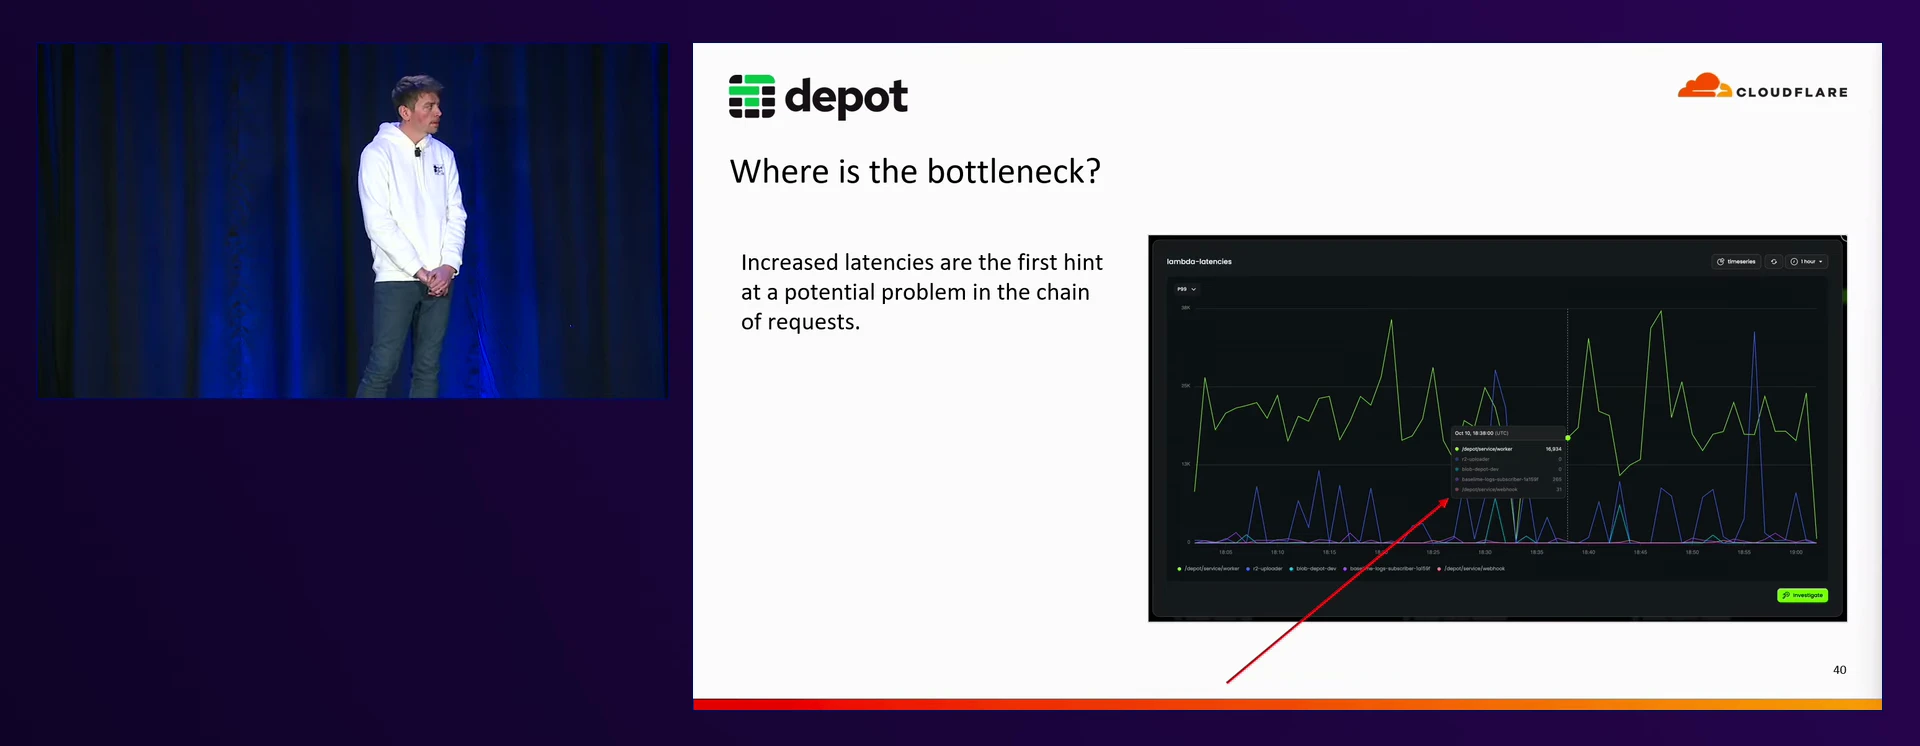
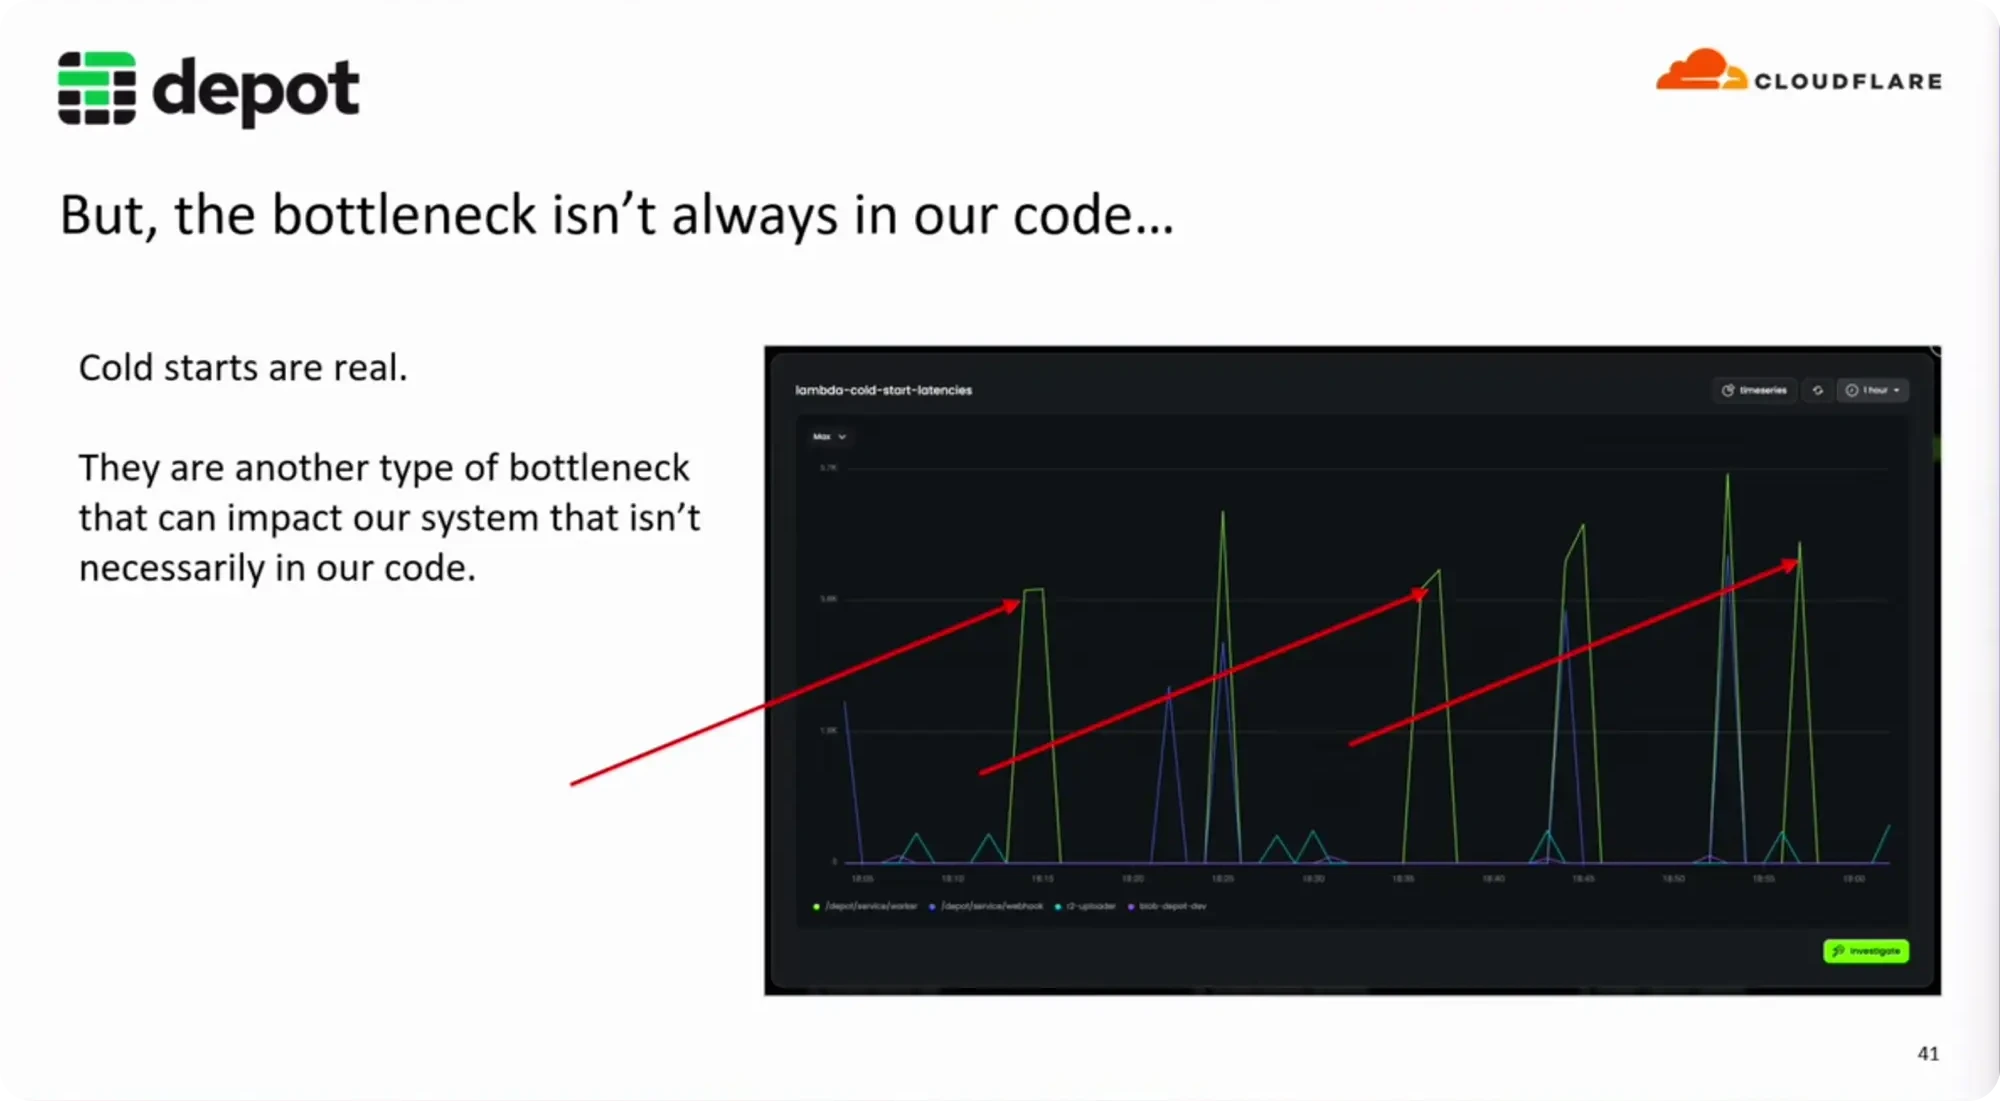
At Depot, we monitor latency across all of our serverless components, and alert when we begin to see a spike outside of our expected range. Just detecting spikes can be problematic as well, as we know that cold starts will appear as a bottleneck in our observability tools, and it isn't necessarily tied to a code issue.
Cold starts, while not tied directly to our infrastructure code, can be affected by what's installed on the EC2 instances. We watch the cold start times to ensure we aren't inadvertently increasing the time it takes to boot up a new instance.
Monitoring across all services
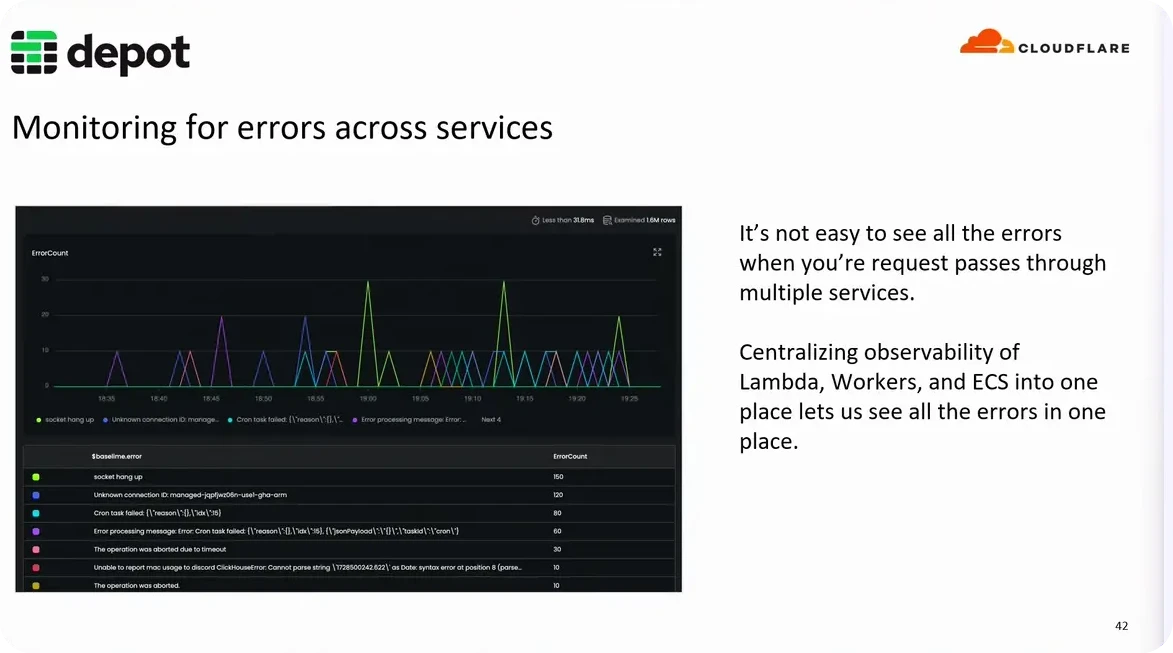
The first step to ensuring we have the full scope of information we need to make informed decisions and debug issues, is centralizing all of our logs, metrics, and traces into a single observability tool. Depot has multiple services that are invoked through multiple functions and even functions across multiple providers, such as in our case of using both AWS and Cloudflare.
Picture here is Baselime, which is currently being built into the Cloudflare platform.
Hunt for outliers
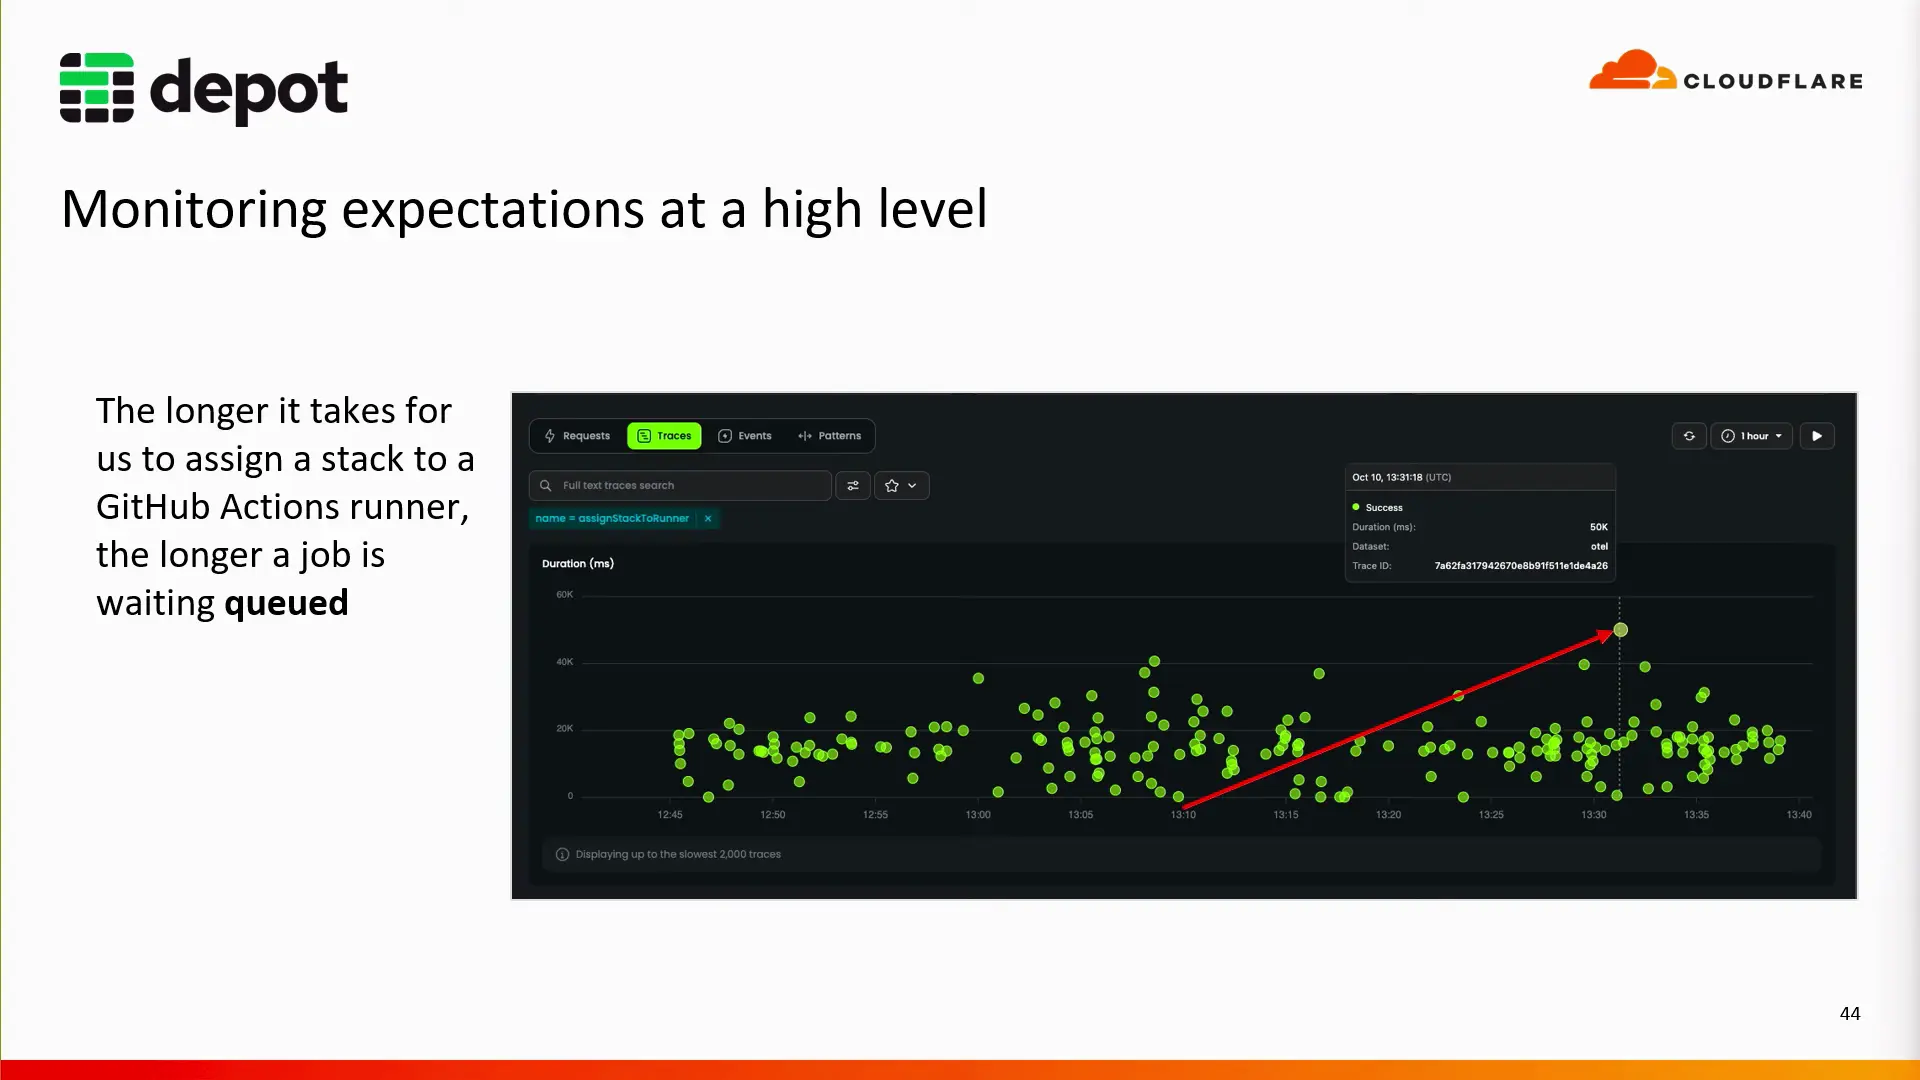
At a high level, we begin by looking at traces for a particular task. In this case, we're looking at the traces for a function that creates the infrastructure stack for a GitHub Action runner, which we want to come online within 10 to 30 seconds. The longer it takes for the infrastructure stack to build, the longer the GitHub action job will be queued. We have an SLA set to a maximum of 30 seconds, which will trigger an alarm if the task takes longer than expected.
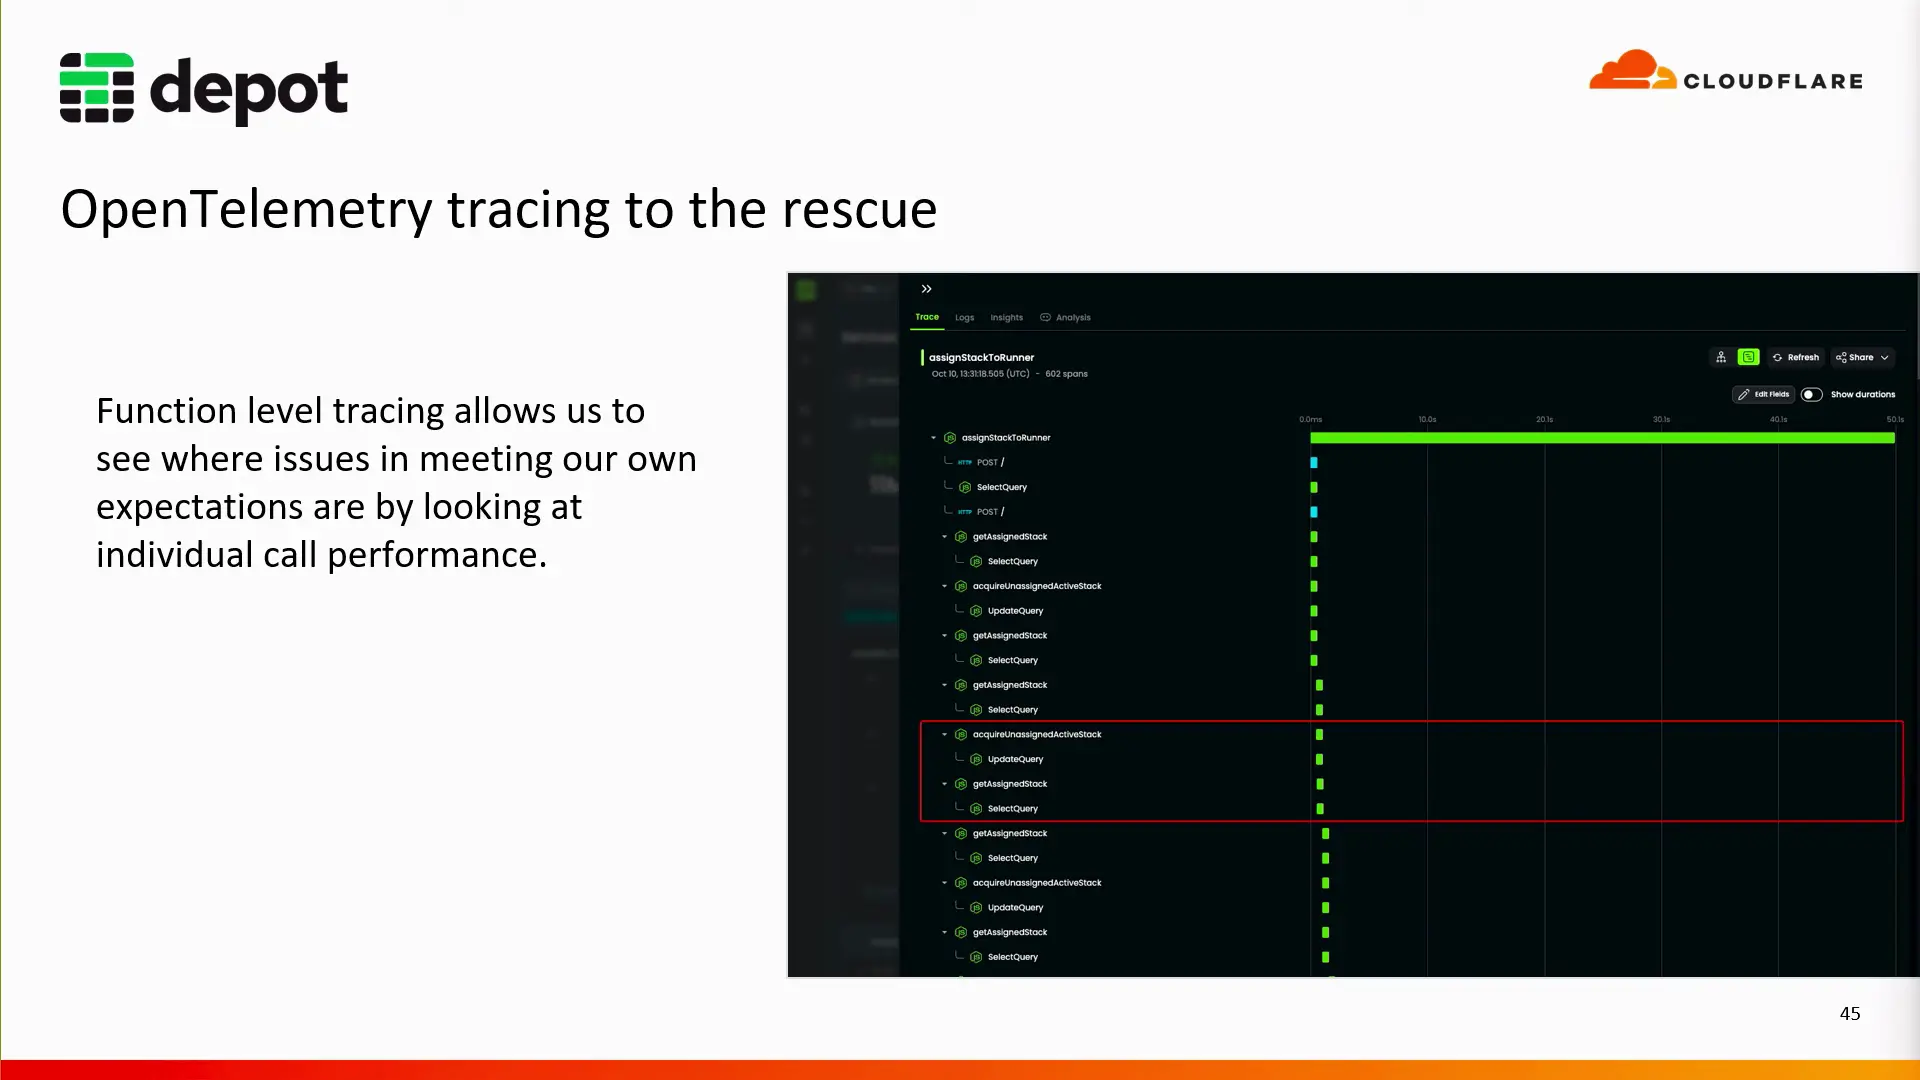
Highlighted in the graph above, is an outlier that took 50 seconds. From inside Baselime we can drill down into the individual trace to get a waterfall view of the individual task, and try to figure out where it spent those extra 20 seconds.
When we take a closer look, we can see the same function has been running several times, increasing our total time. The acquireUnassignedActiveStack function is running in a loop, and hasn't been able to get an infrastructure stack to assign to the runner. This could be because of a lack of available compute resources, or maybe a race-condition where the stack is being assigned to another runner. In this case, it was the latter, which was resolved with SQS FIFO (First In, First Out) queues, brining all of our infrastructure stack assignment times back within our SLA.
Conclusion
Observing a distributed serverless stack is inherently complex, but especially so when operating within a walled garden or across multiple providers. Adopting OpenTelemetry compliant observability tools to centralize your logs, metrics, and traces is vital to getting a full view of your system. And to tie everything together, ensure you are collecting high-cardinality / high-dimensionality metrics with as much context as possible to make it easy to correlate data across your different components and services.
Related posts
- Introducing Ultra Runners — Up to 3x faster GitHub Actions jobs
- Making EC2 boot time 8x faster
- Accelerated local builds, with instant shared cache

