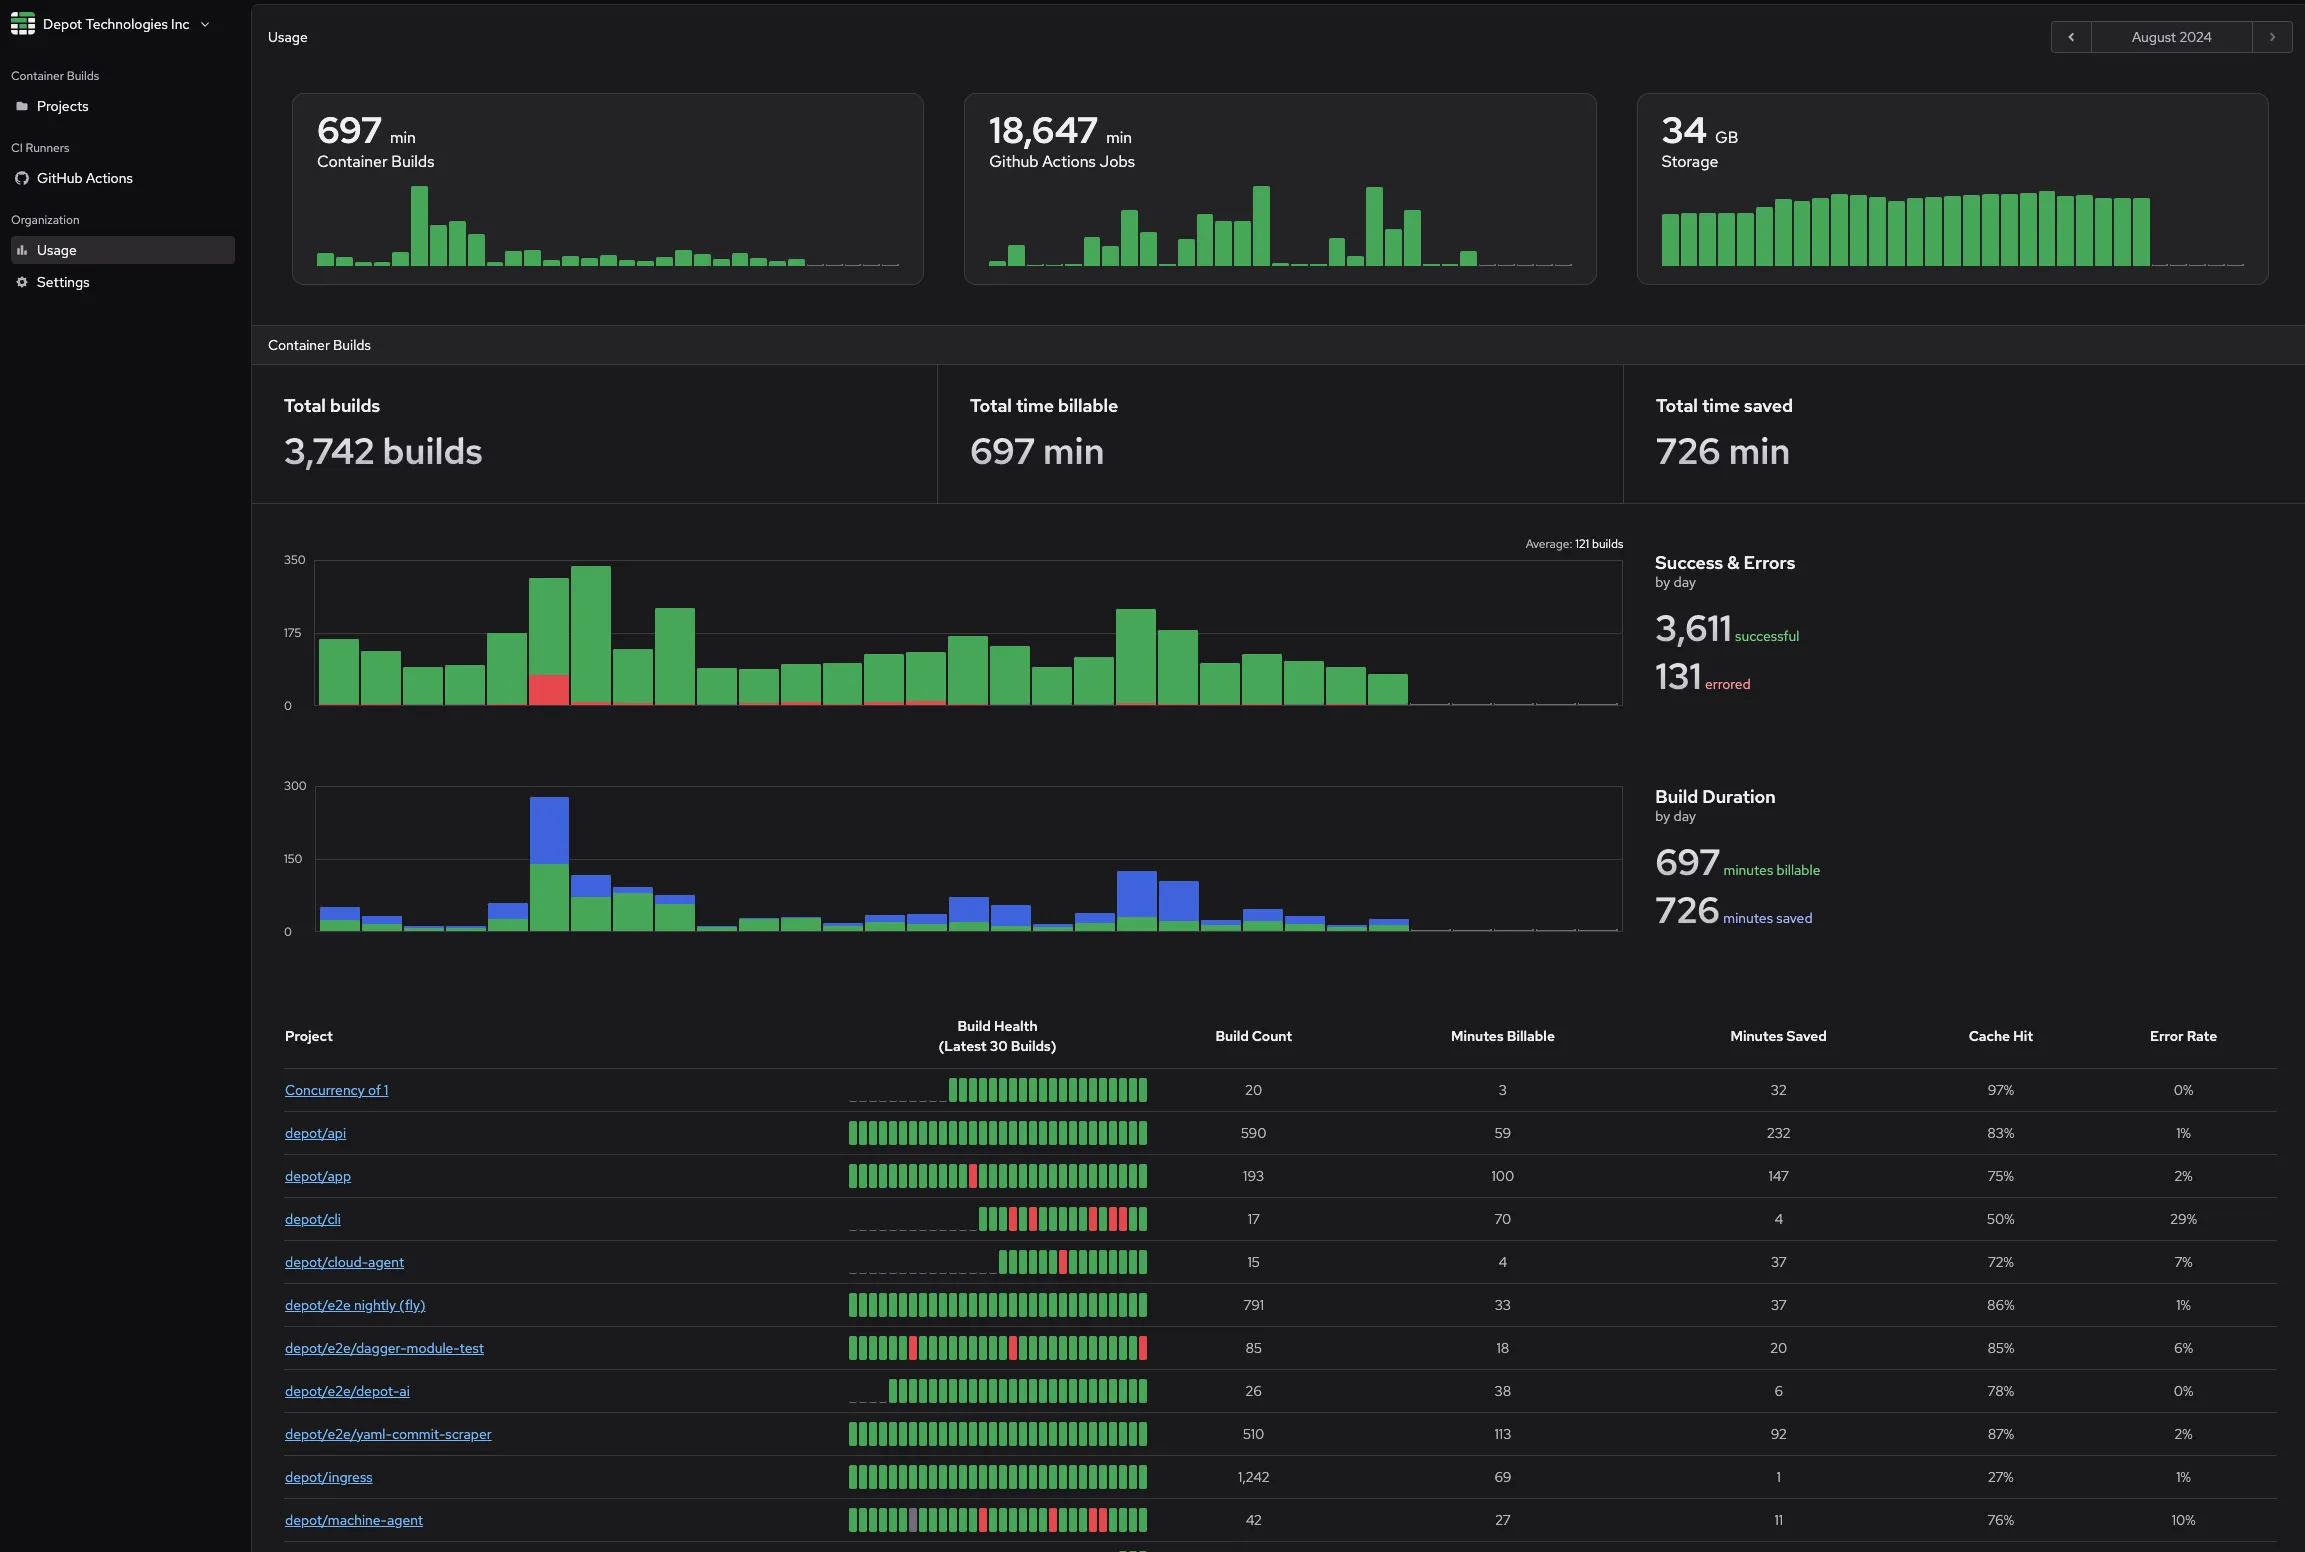
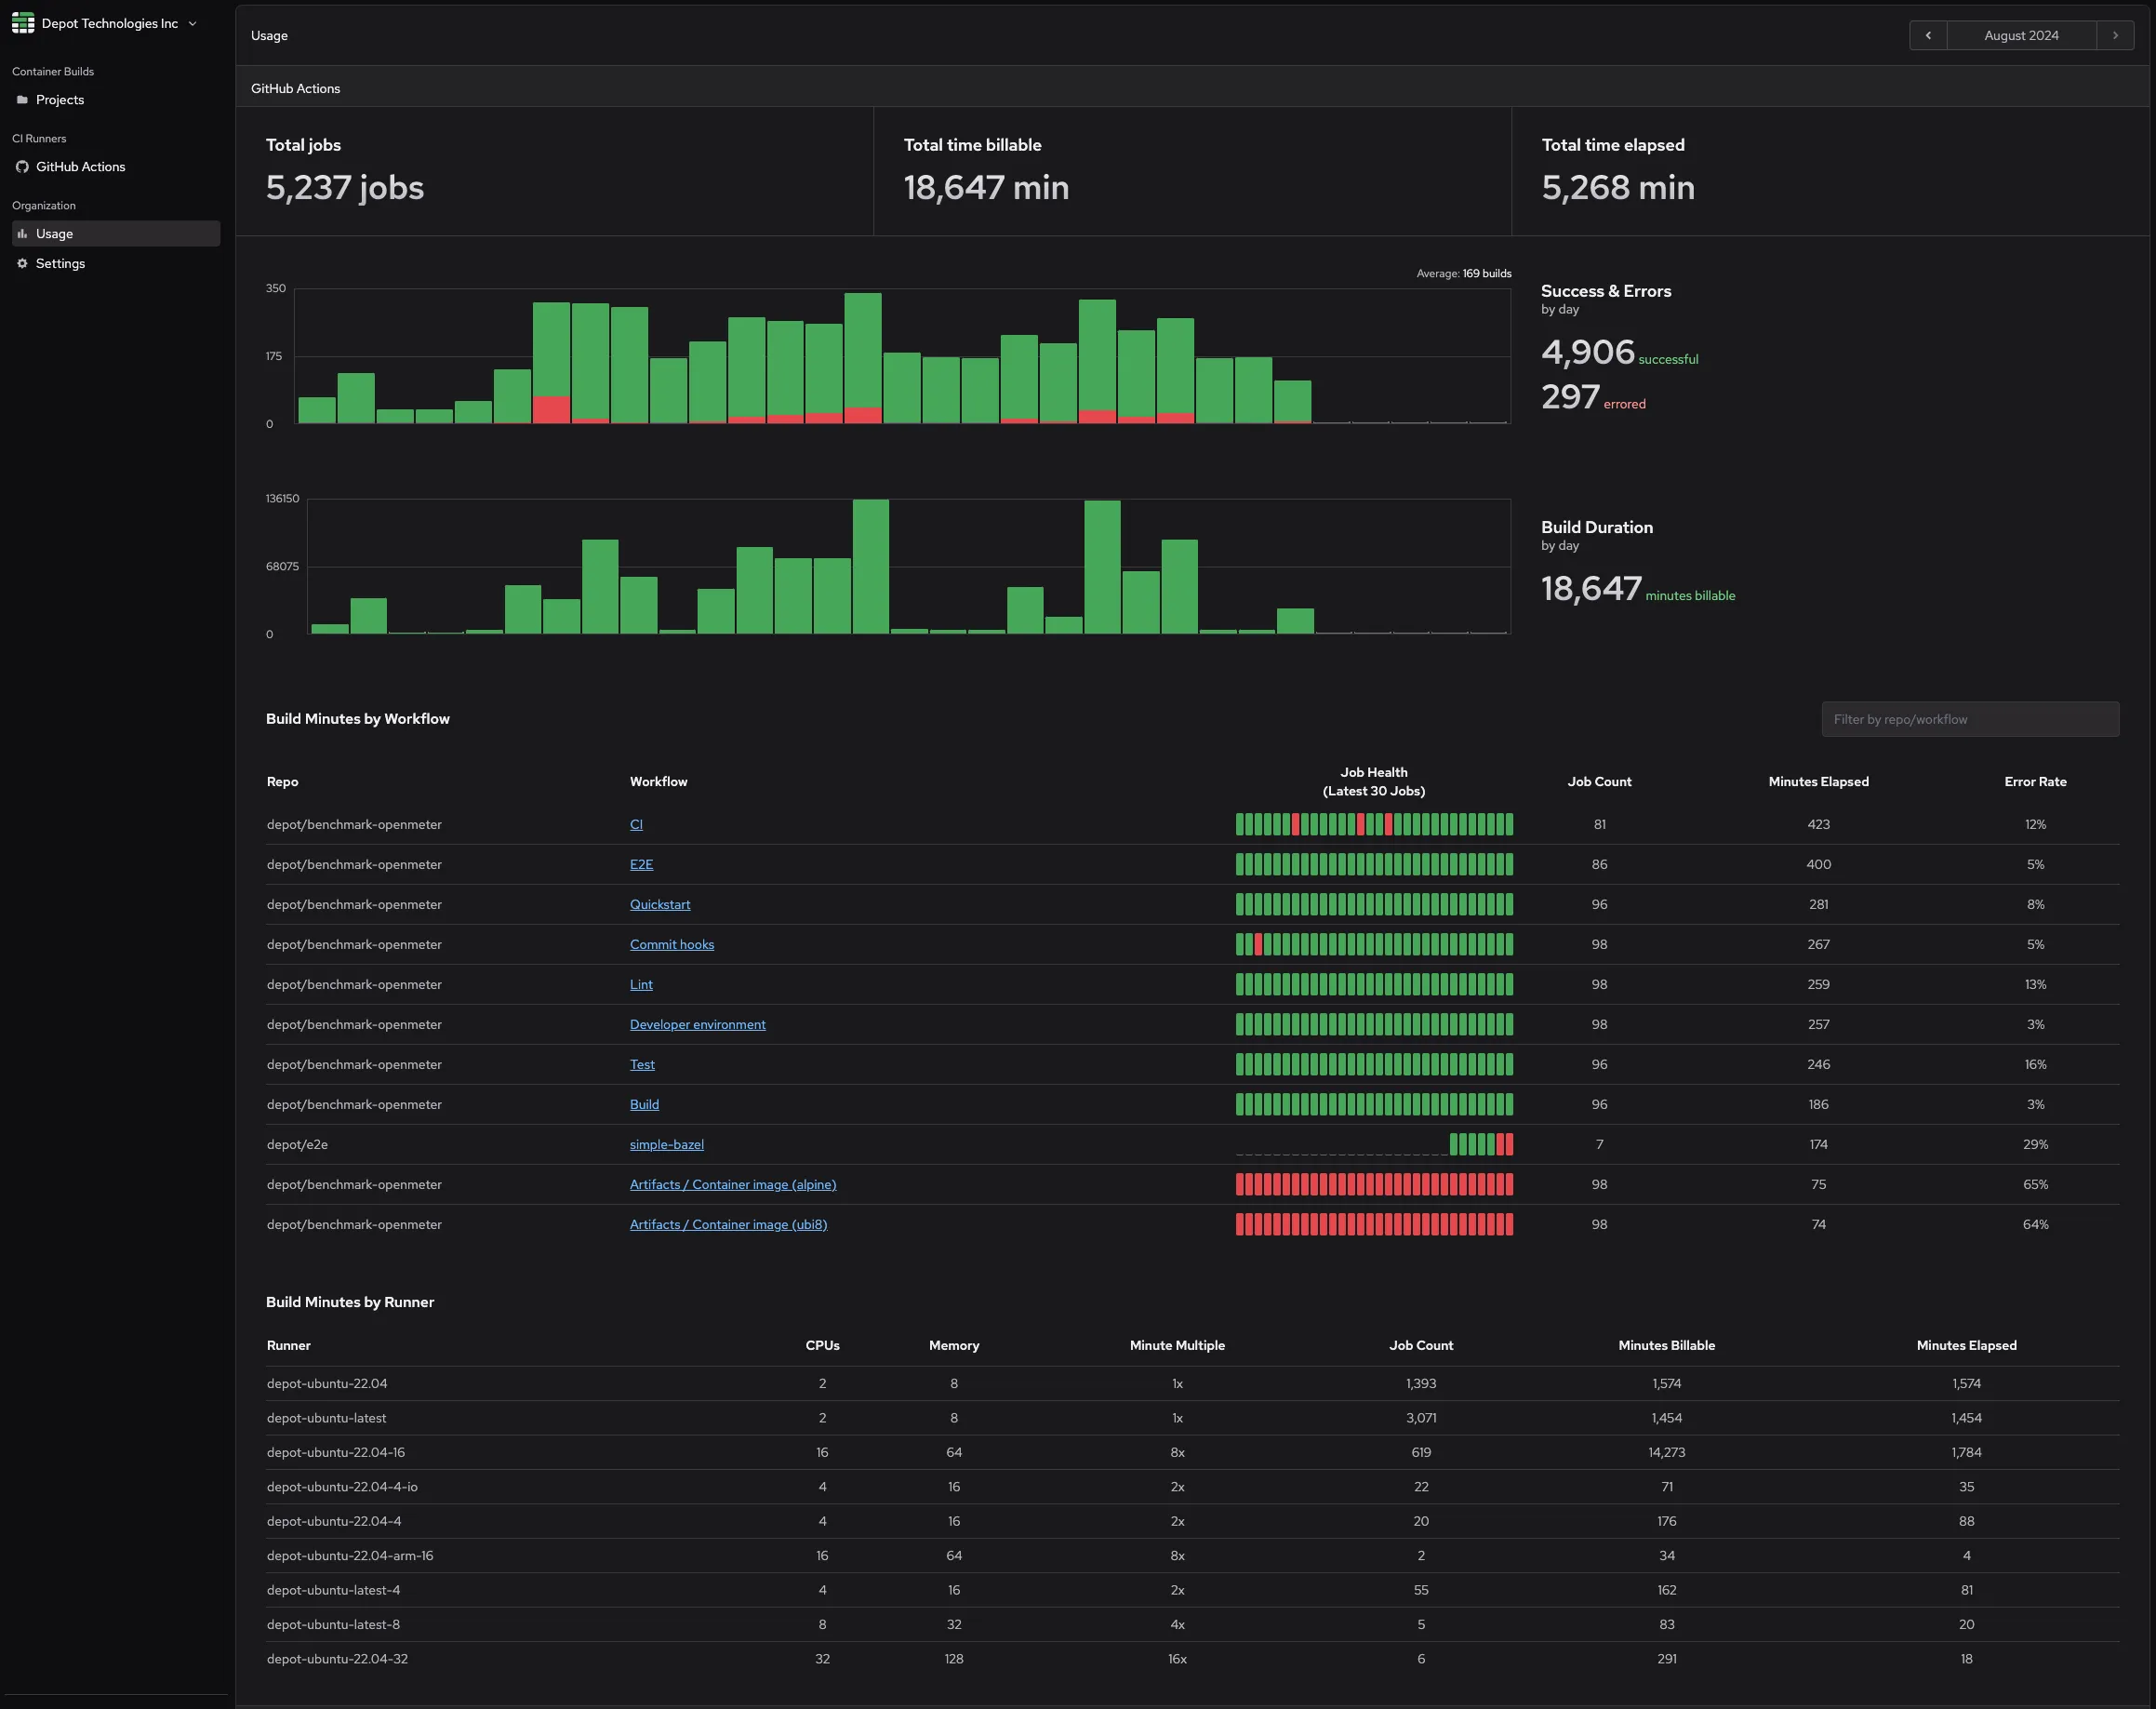
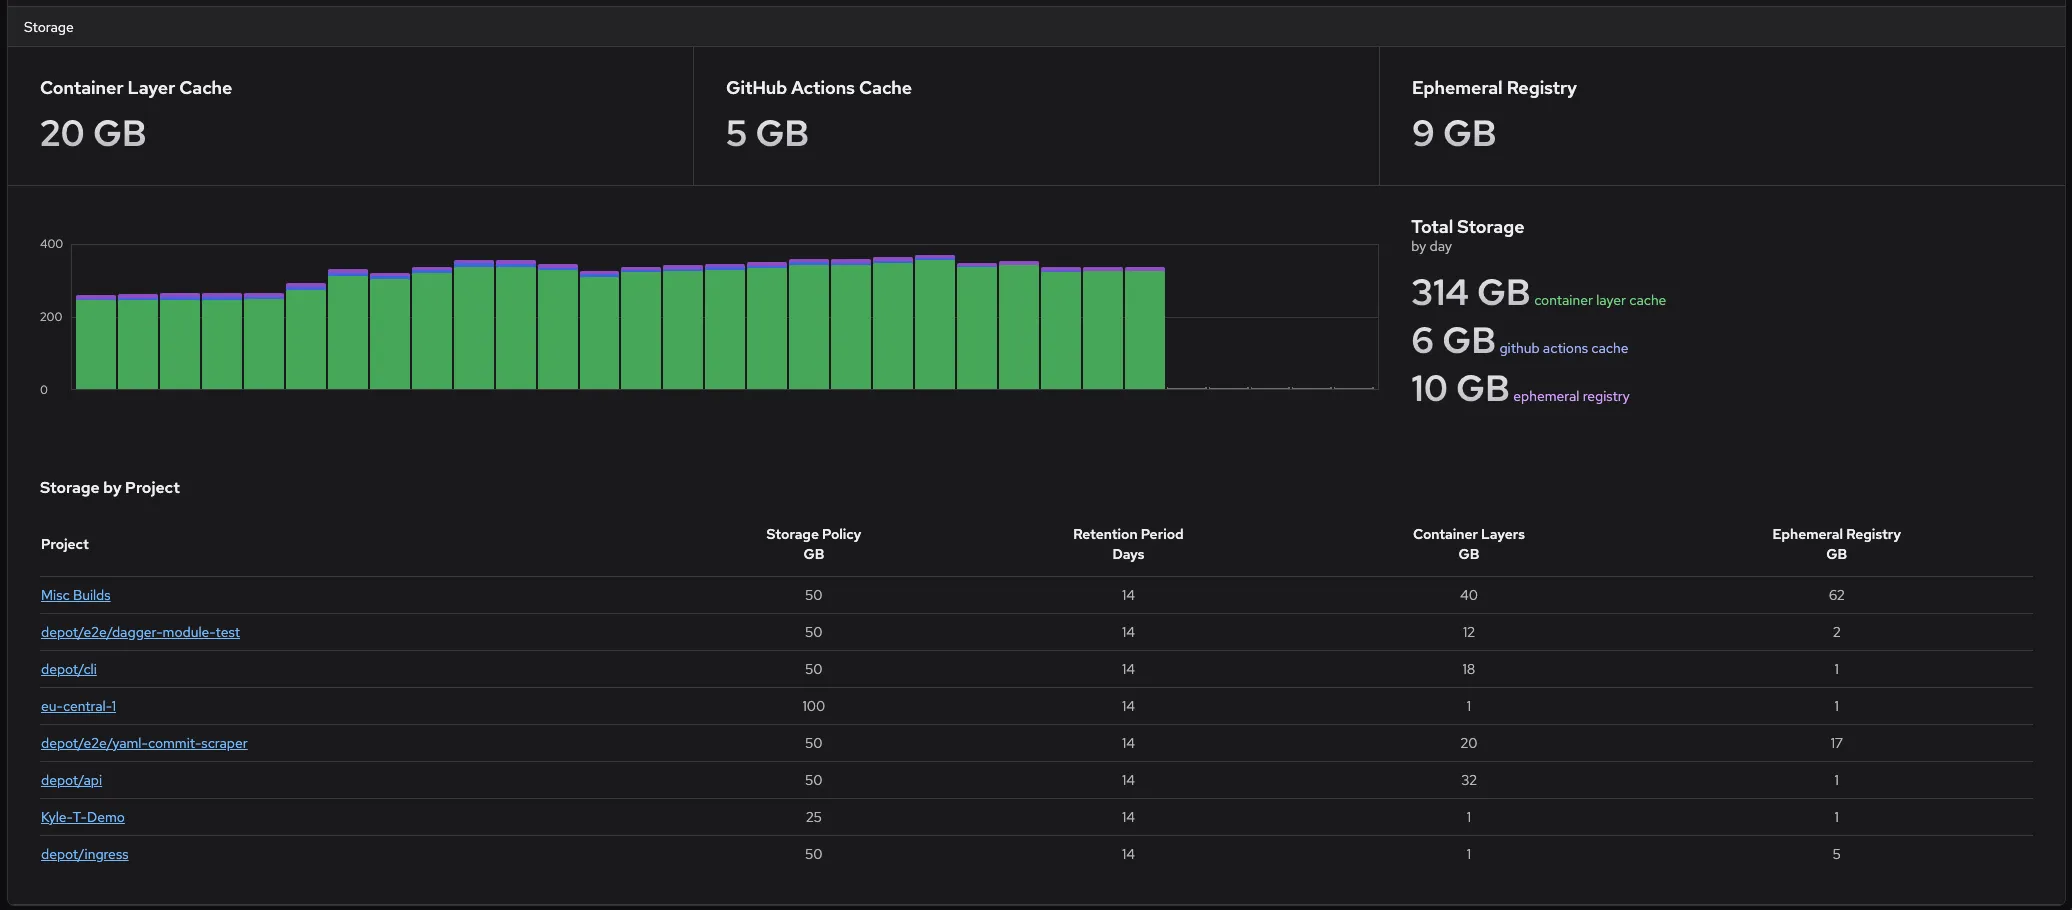
This month, we've been hard at work building an upgraded Usage & Analytics experience for Depot. This new feature provides a detailed breakdown of your organization's usage, including container builds, GitHub Actions analytics, and storage usage.
Container builds usage and analytics
There is now an updated Container builds section inside of your Organization Usage page. This section provides a detailed breakdown of each project's container-related usage for the selected billing period. For each project, we surface:
- Build health: see the success/error rate over the last 30 builds.
- Number of builds: see how many builds have run.
- Billable minutes: get an idea of how much build time you're being billed for a project.
- Minutes saved: see how much time you save using Depot to build that Docker image.
- Cache hit rate: see how often Depot was able to use the cache to speed up a build.
GitHub Actions analytics and runner breakdowns
We've added a new GitHub Actions section to the Organization Usage page. This section provides a detailed breakdown of your organization's GitHub Actions usage and workflow analytics for the selected billing period. For each repository and workflow, we surface the following:
- Job health: see the success/error rate over the last 30 jobs.
- Number of jobs: see how many jobs have run for a workflow.
- Minutes elapsed: see total elapsed time for a workflow.
- Error rate: see the overall error rate for a workflow.
We also added another section that allows you to see a breakdown of build minutes by runner type for your GitHub Actions workflows. This can help you identify which runners are used the most and how much time is spent on each. For each runner type, we surface the following:
- CPUs: see the number of CPUs available for a runner label.
- Memory: see the amount of memory available for a runner label.
- Minute multiple: used to calculate the billable minutes.
- Job count: see how many jobs have run for a runner label.
- Billable minutes: see how much time you're being billed for a runner label.
- Minutes elapsed: see total elapsed time for a runner label.
Storage usage
Finally, we've added a better visualization of three flavors of cache storage in Depot. You can now see your total usage for Container Layer cache, GitHub Actions cache, and our Ephemeral Registry.
The container layer cache and ephemeral registry storage are both tied to Container Build projects, so we also surface a project-level breakdown of your cache usage:
- Storage policy: tells you the maximum layer cache to store for each architecture in a project.
- Retention period: tells you how long the layer cache is stored before being deleted.
- Container layer cache: see how much storage is being used for the container layer cache.
- Ephemeral registry: see how much storage is being used for the ephemeral registry.
Try it out today
We're working on some additional insights across your organization and projects, so stay tuned for more updates. If you have thoughts on the most important or your favorite stat to watch over time, let us know in our Discord Community.
If you have yet to try out Depot, we're making builds up to 40x faster! You can sign up for a free trial without a credit card and try it out for yourself.


