Depot CI usage now on the org usage page
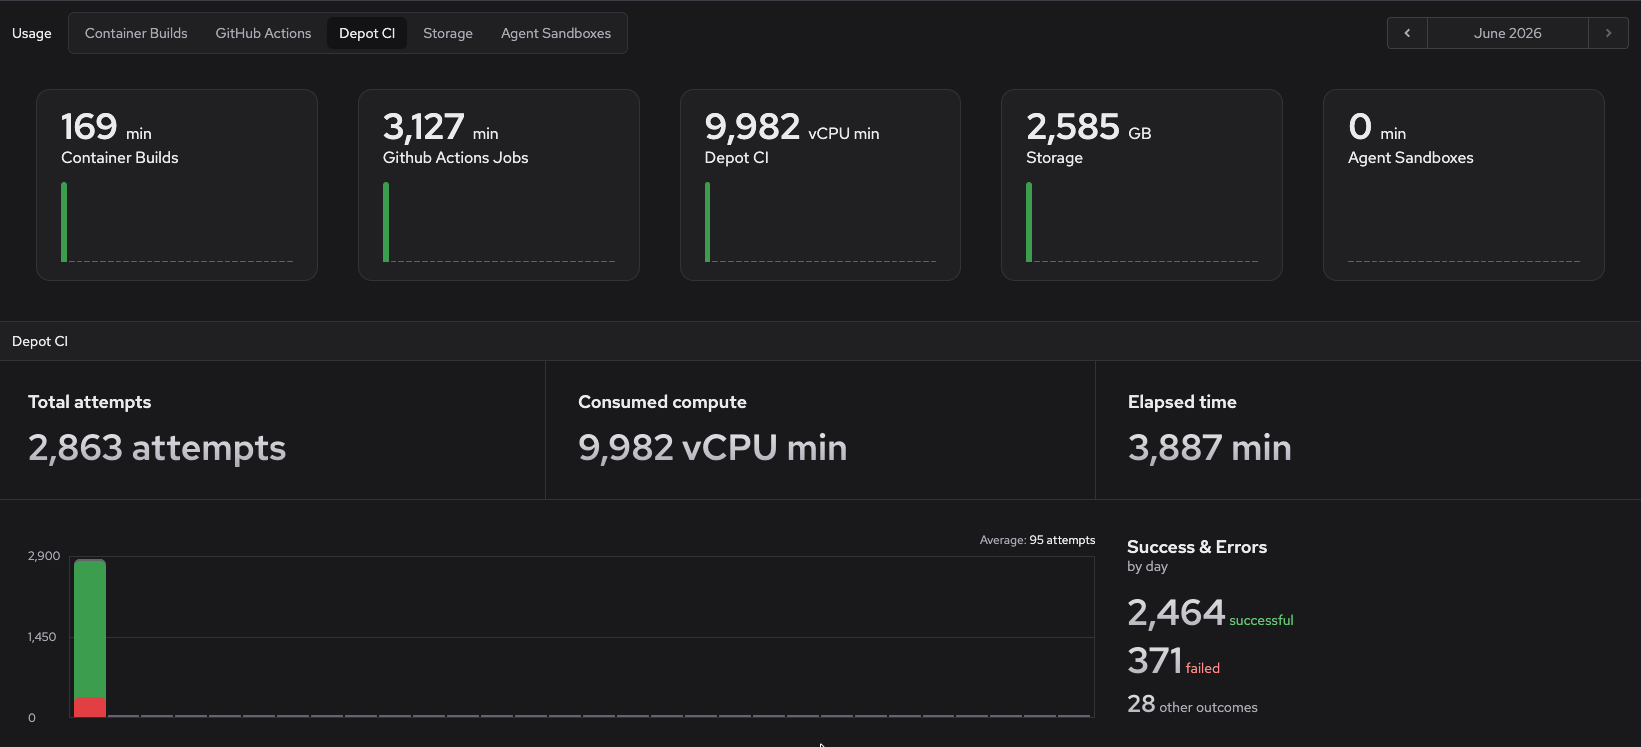
Your organization's usage page now includes Depot CI, so you can see exactly how much compute your CI runs consume alongside Container Builds, GitHub Actions, Storage, and Agent Sandboxes.
A new section switcher lets you focus on one product at a time while the monthly summary and month navigation stay in view. The Depot CI section shows:
- Overview: total attempts, consumed compute, elapsed time, an outcome breakdown, and a vCPU-minute trend chart for the month.
- Usage by workflow: a sortable, filterable table of per-workflow attempts, vCPU minutes, elapsed minutes, average duration, and error rate, with recent-attempt health bars and links into individual workflow jobs.
Depot CI usage tracking began on June 1, 2026, so you won't see Depot CI data for prior months.