Inline build step analytics
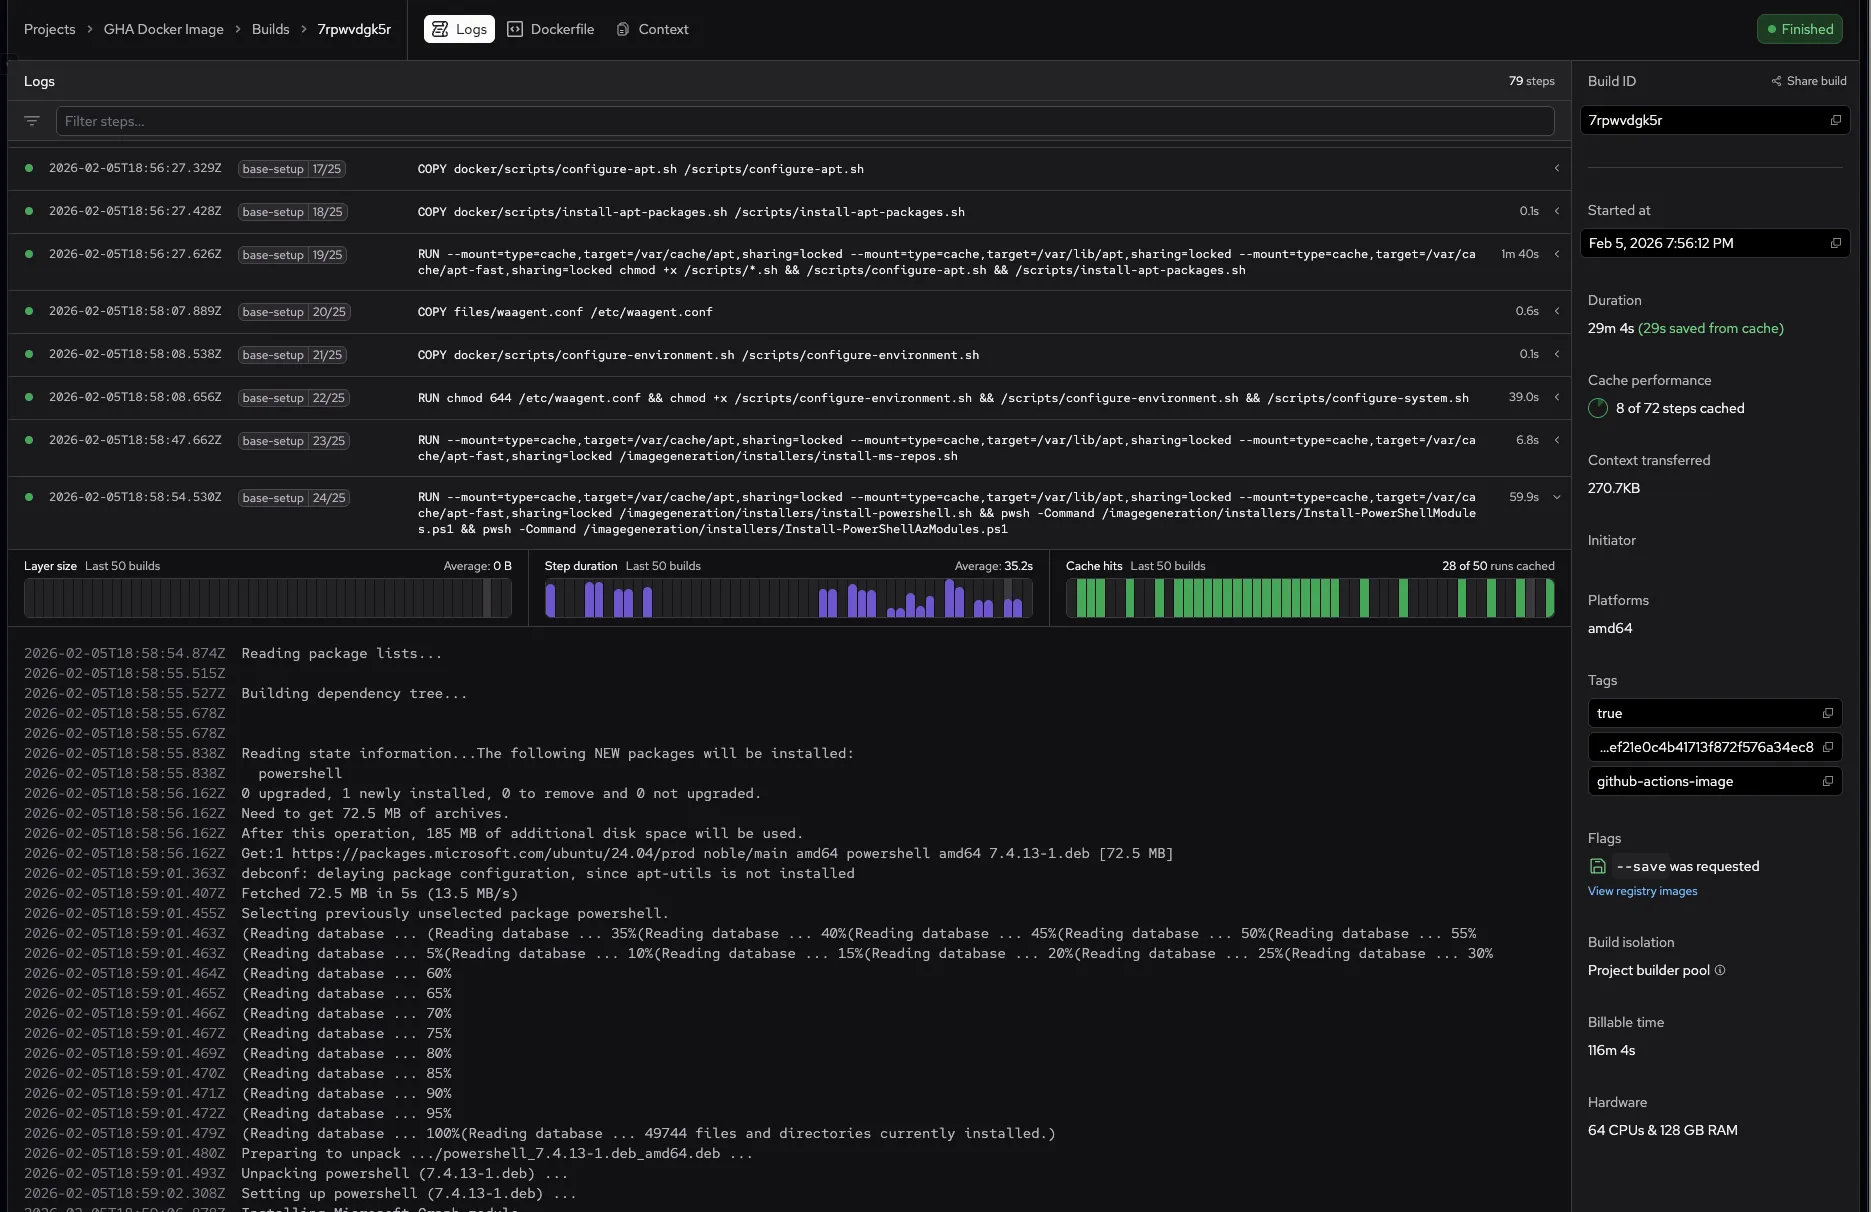
Build logs now show step performance graphs directly inline when you expand a build step. Click any step with a chevron to see layer size, step duration, and cache hit charts for the last 50 builds — all without leaving the logs view.
Previously, viewing step analytics required opening a separate side panel. Now the graphs appear right above the step's logs, making it faster to spot performance regressions and cache issues while reviewing a build. Steps without logs but with historical data are also expandable, showing the charts with a "No logs for this step" message.
Hovering over a chart bar shows the exact build date and value inline, replacing the summary text in the header.