We're excited to release the first version of cache statistics for your builds 🎉
As a remote build service, we're uniquely positioned to surface interesting insights about builds. For example, one of the biggest requests from folks using Depot is to see how much time is spent in each step of the build process.
Today, we are releasing the first version of this idea, and we will be expanding it over time.
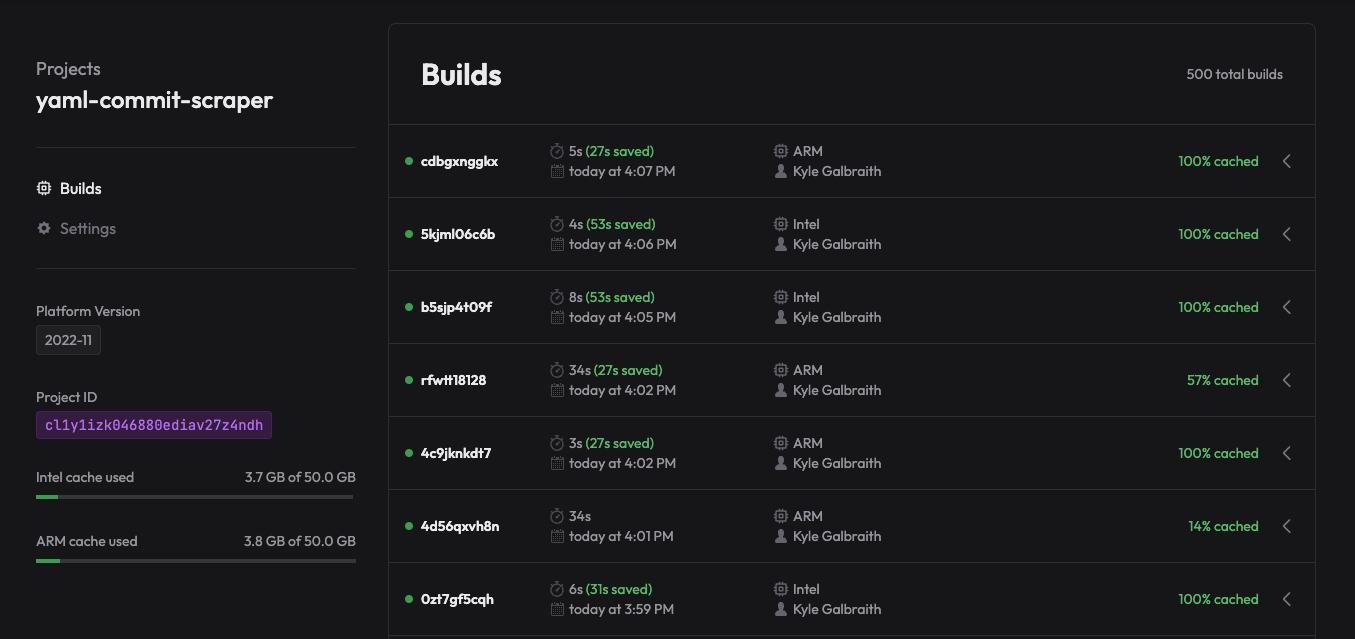
Here we are surfacing how much of your build was cached and how much time that actually saved from the total build time. We can see that my three latest builds are 100% cached, resulting in a savings of 27, 53, and 53 seconds for a total savings of over two minutes in the past three builds.
When you hover over the cache percentage, we show you the count of how many steps of your build were cached versus uncached.
For this build, 8 of the 14 steps were cached, a hit percentage of 57% and a savings of 27 seconds.
In the coming weeks, we will add even more insights, including time saved and cache hit percentage over time, finer-grained insights about cache contents, and hotspot analysis showing the build steps contributing the most time to your build.
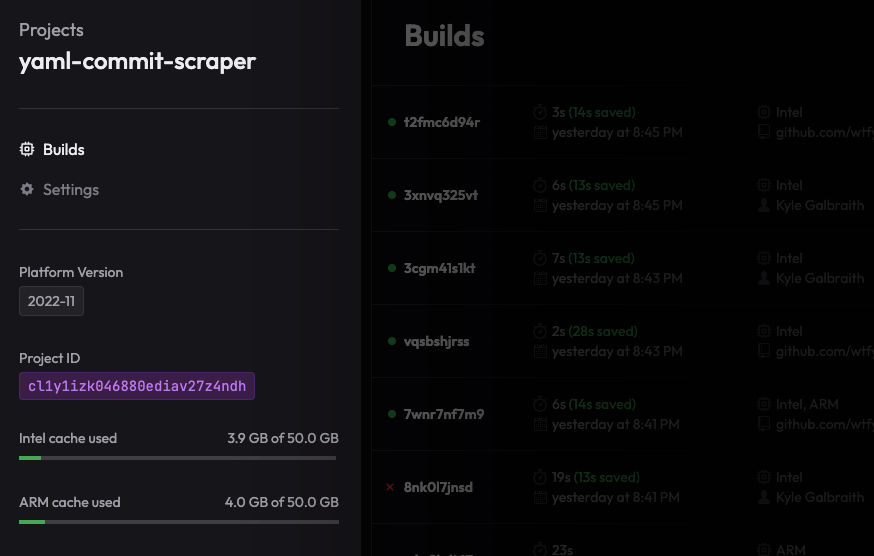
Lastly, we've added the ability to see how much of your cache space you have used for both Intel and Arm. Behind the scenes, we automatically evict old cache on a garbage collection loop, but it's still helpful to know how much of your cache space you are actually using.
We are excited to add more information about your builds and cache usage over time. If you have any feedback or suggestions, please reach out to us and let us know.


