The theme for Depot Drop Week #02 is visibility. Understanding what is actually happening inside a Docker build can be frustrating, and existing tools and solutions often require deep knowledge of Docker, OCI, or BuildKit.
Today, we are excited to release the first version of Build Insights, providing a better understanding of each build step, its dependencies, what it executed, and how it interacted with the cache, for every build.
This increased visibility makes it easier to debug issues and understand overall build performance, and it's now available for all Depot projects!
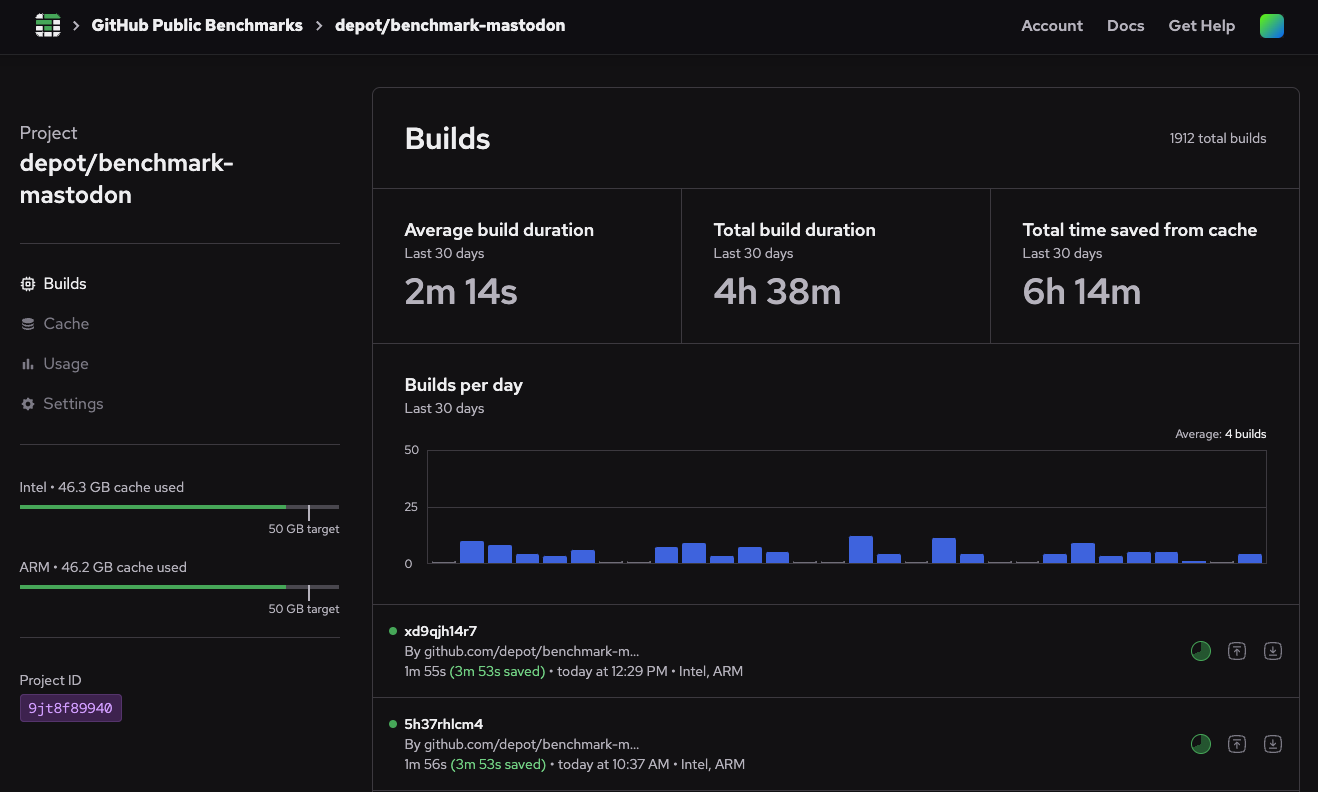
Build list: the project's overall build health
To kick things off, the project build list now includes some overall stats about your builds over the last 30 days. These include average build duration, builds per day, total build duration, and how much time you've saved by using Depot cache:
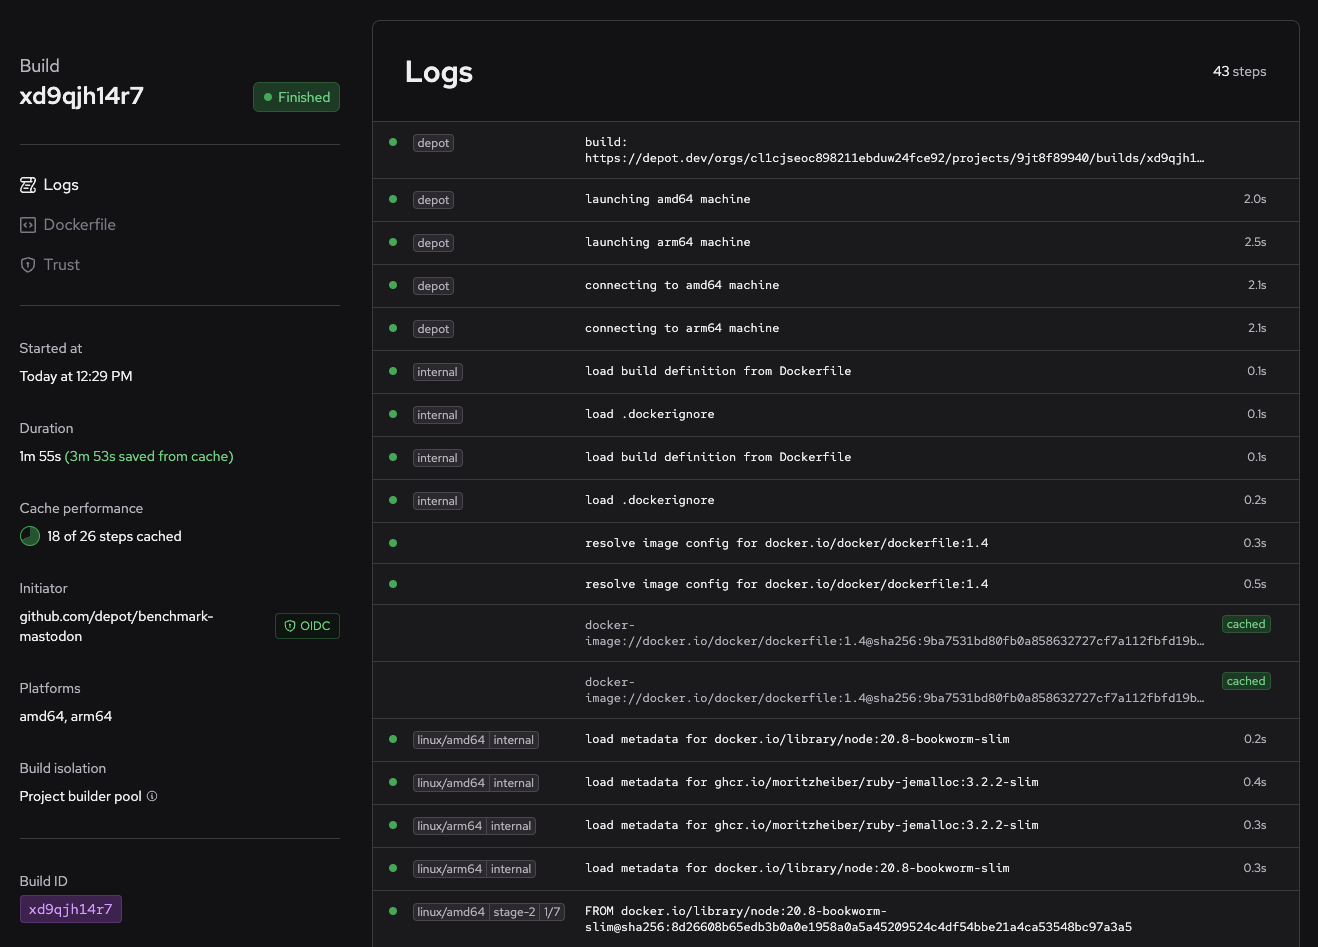
Previously, clicking on a build in the list opened a list of build steps, with only names and durations for each step. Now it opens the build insights. This includes details like build duration, cache performance, what compute platforms were used, and build isolation on the left sidebar, as well as three detail views: Logs, Dockerfile, and Trust.
Logs: what happened during the build?
The default insights view is Logs, which shows list of all build steps that took place during the build, very similar to the output of docker build or depot build in an easier-to-understand format.
For each step, you can see whether the step succeeded or failed, the step's stage, name, total duration, and whether the step was cached:
Clicking on any of the steps opens the step detail pane.
Step detail pane: what did the step actually do?
The step detail pane includes both current and historical build performance information for just the selected build step. These include:
- The full step command
- Step duration over time
- Historical cache hits and misses
- The raw Docker layer size that the step produced
- Full terminal output of the step's execution
Clicking on any of the historical build metrics allows browsing to those previous builds:
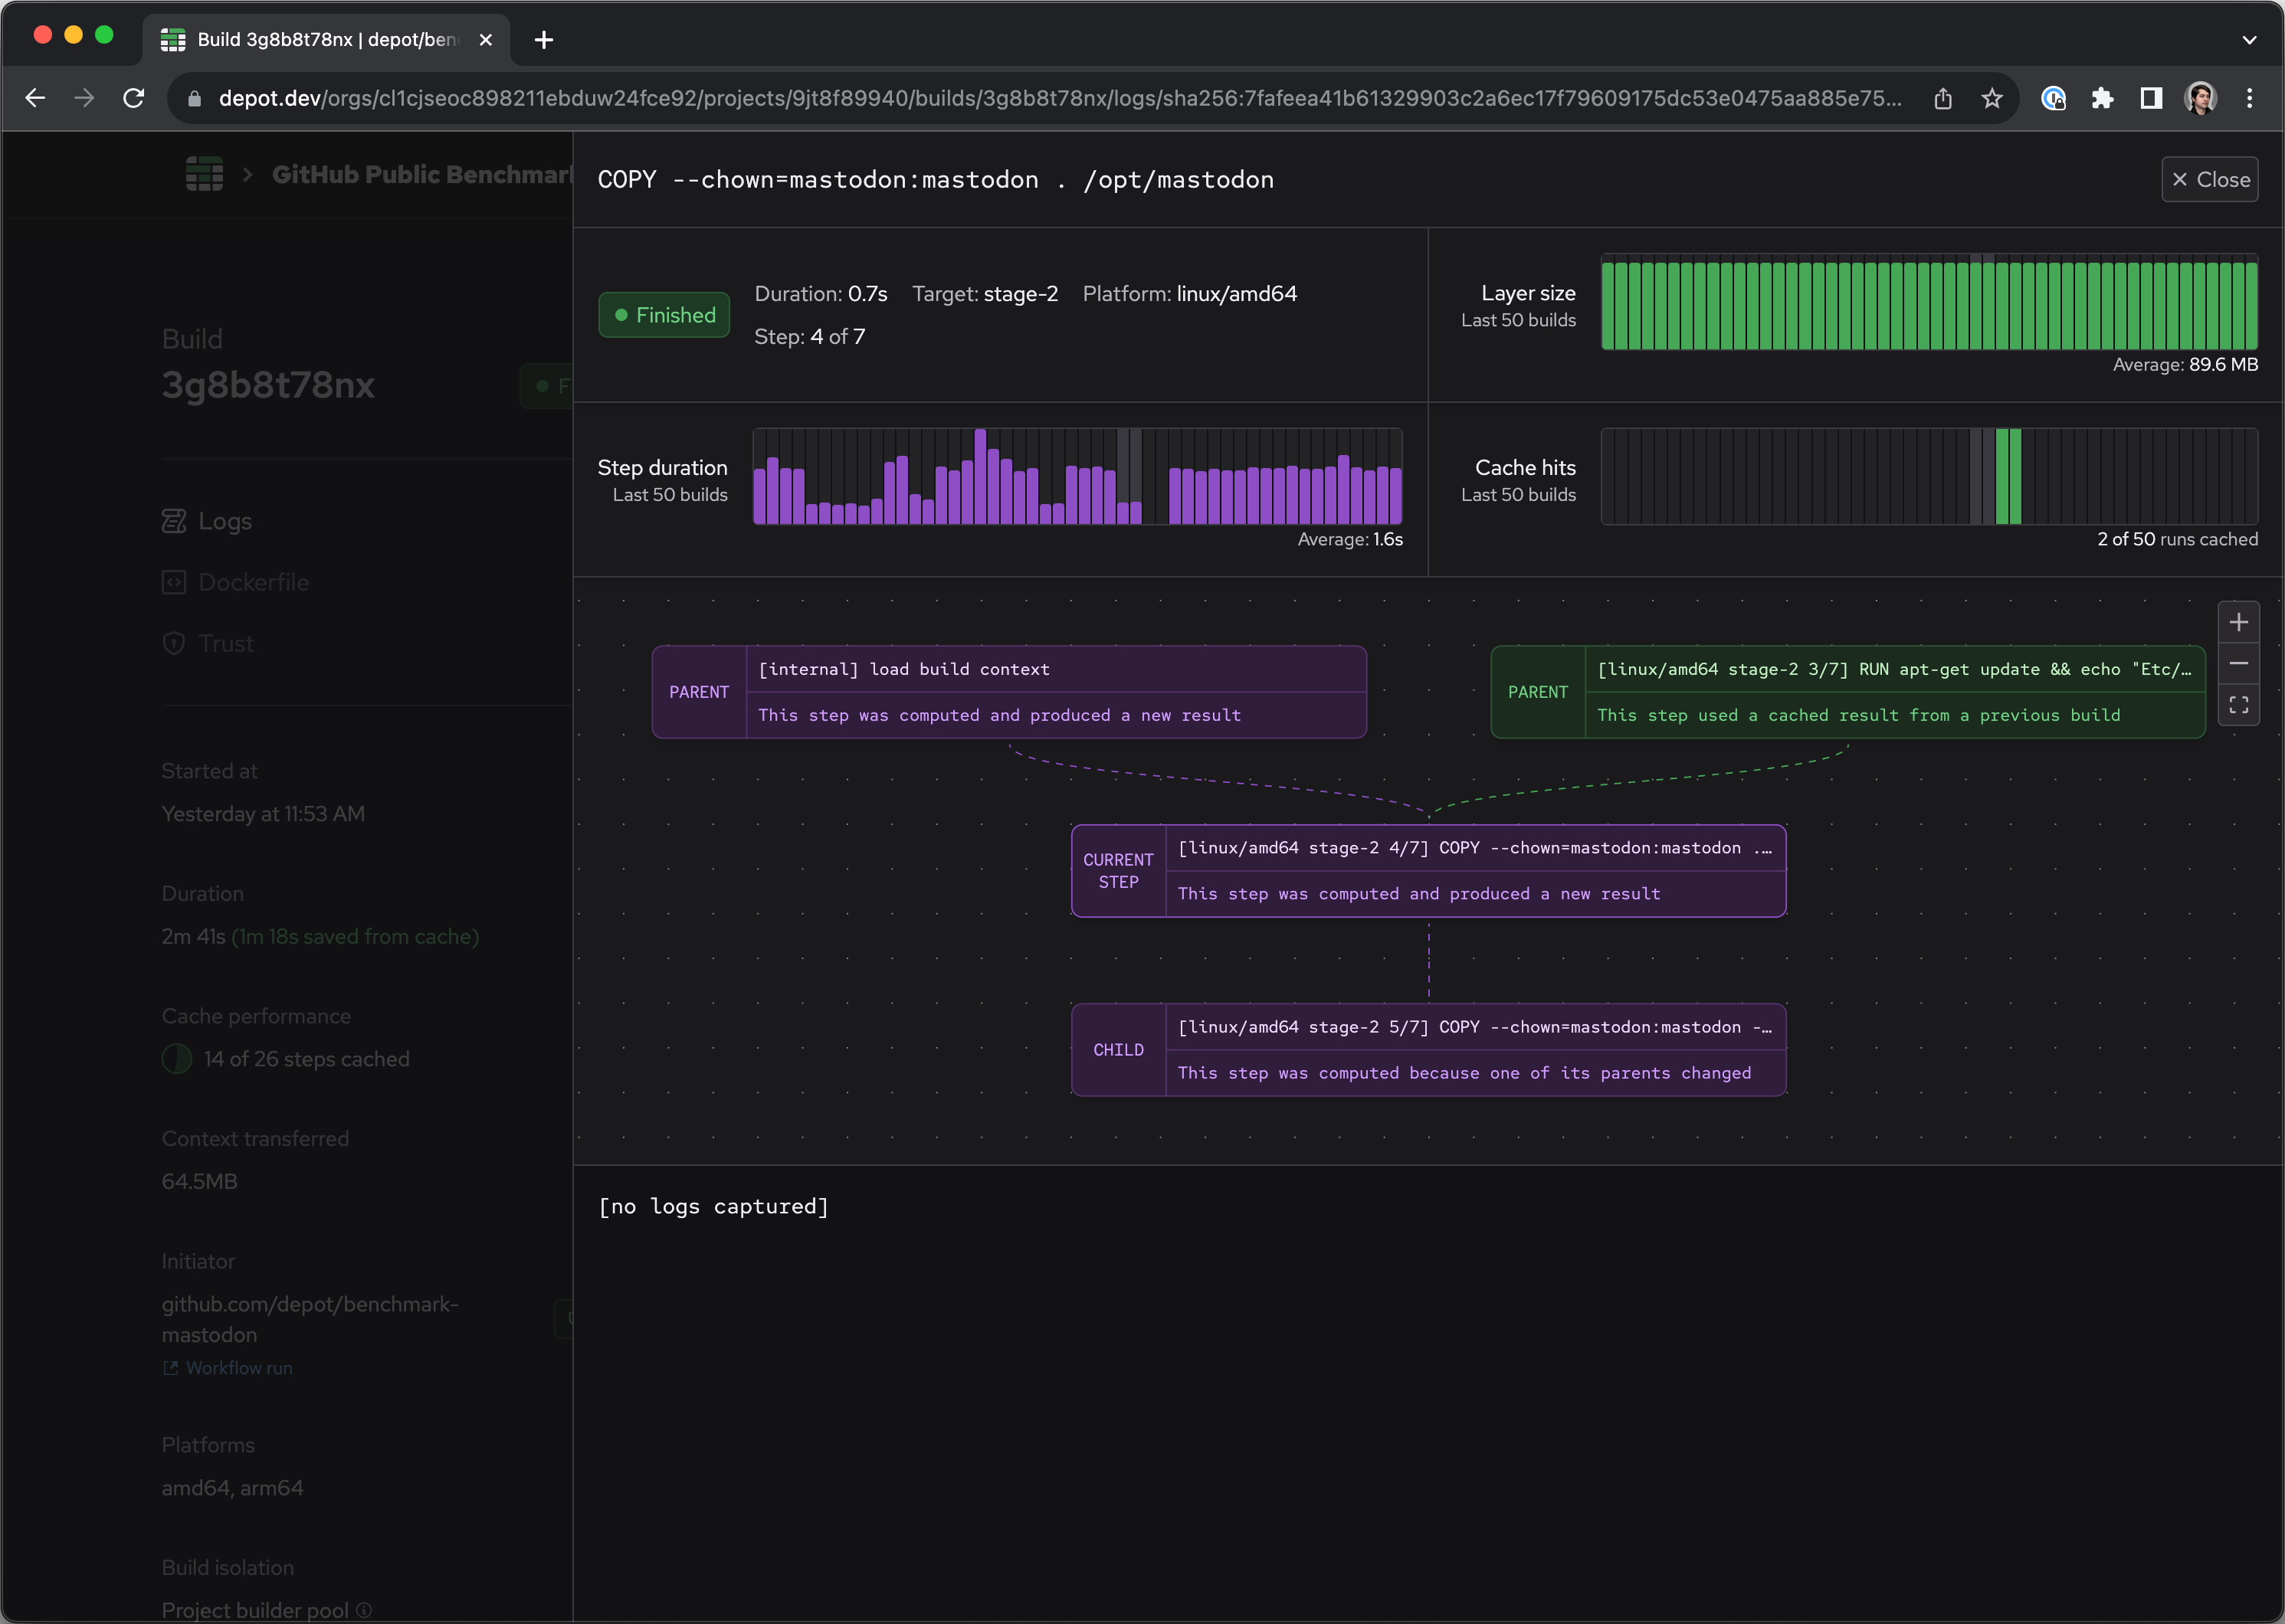
Additionally, you can see the parent and child relationships that this step has with other steps in the build, and how these steps have interacted with cache:
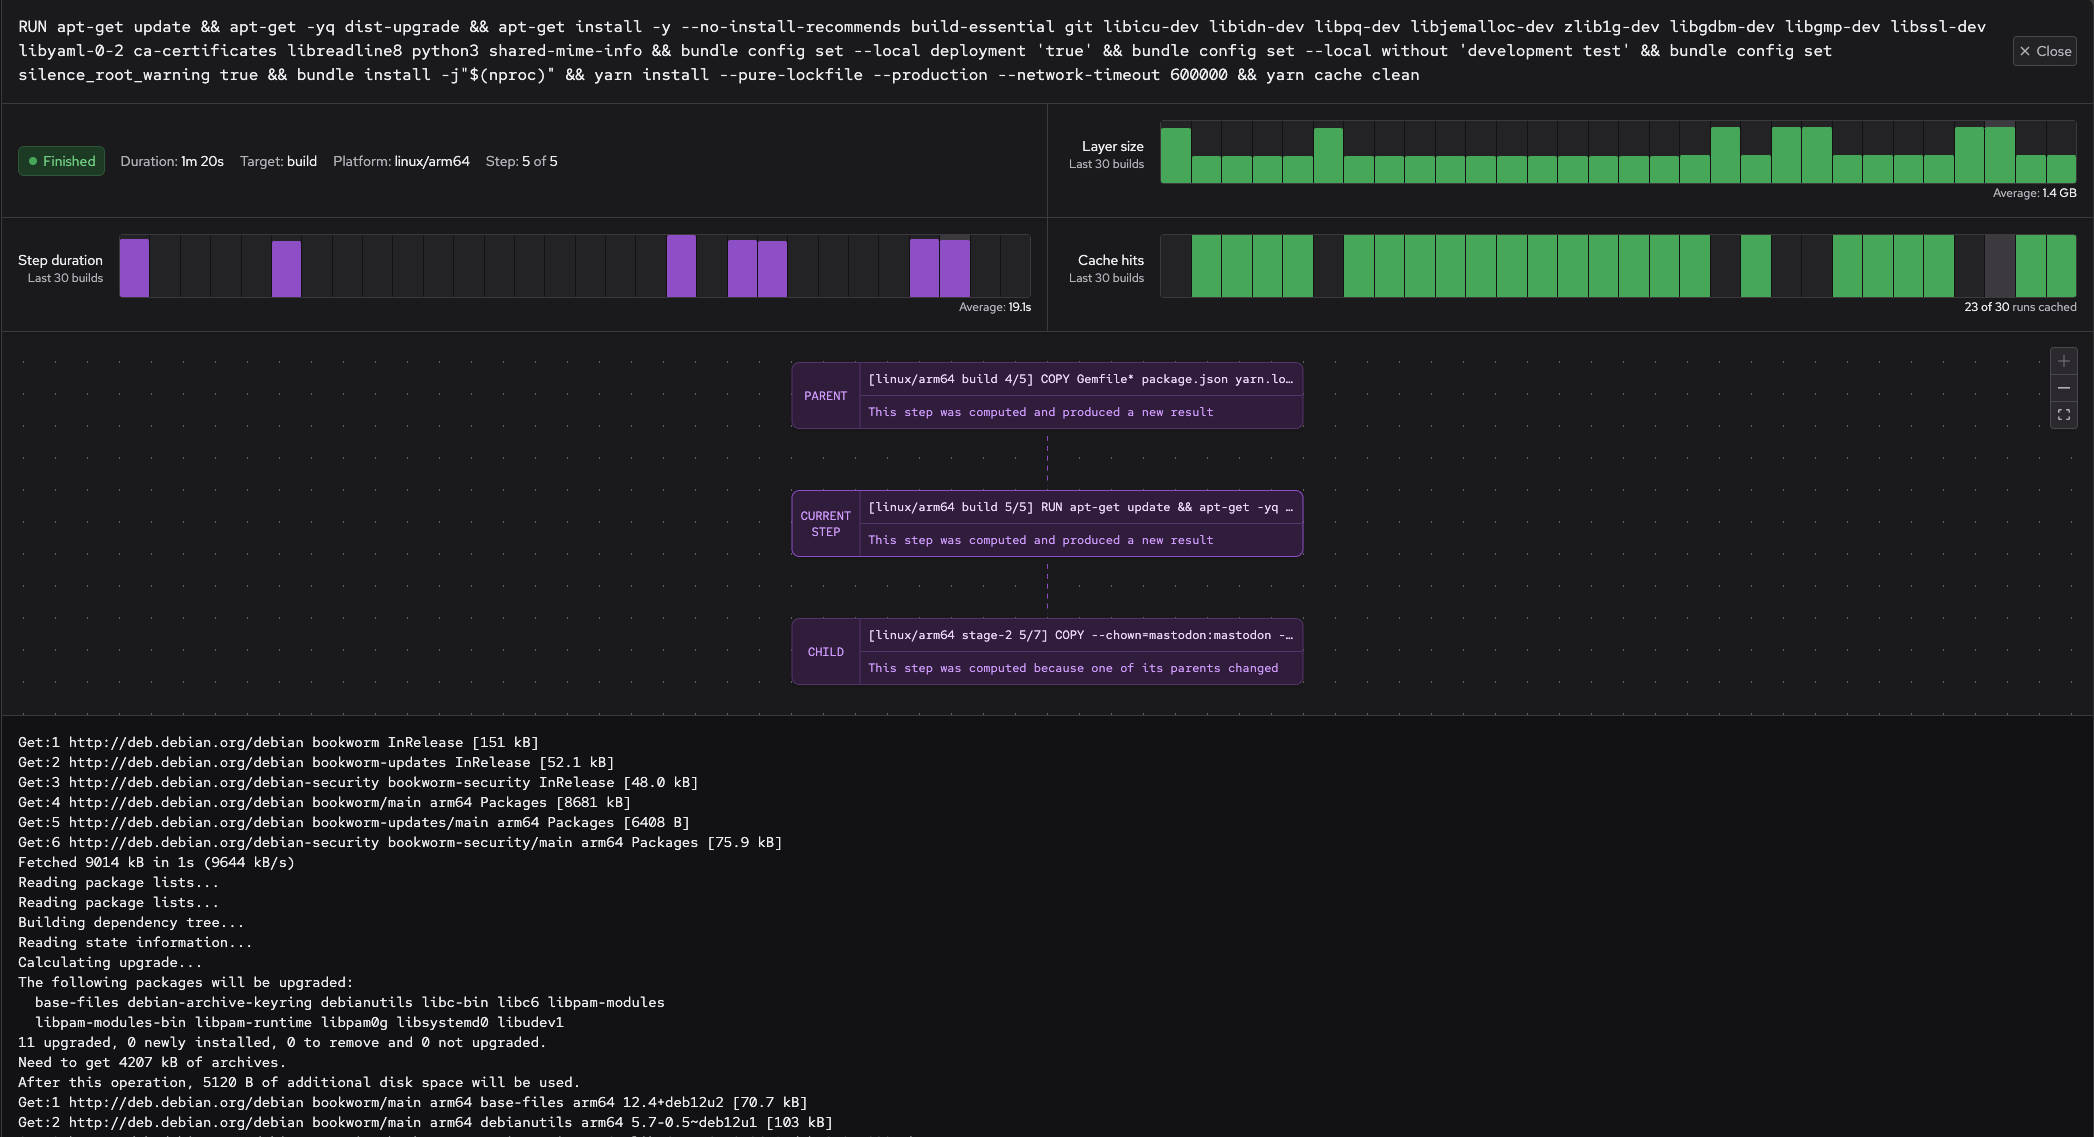
For example, here's a build step that was evaluated because a file in the build context changed:
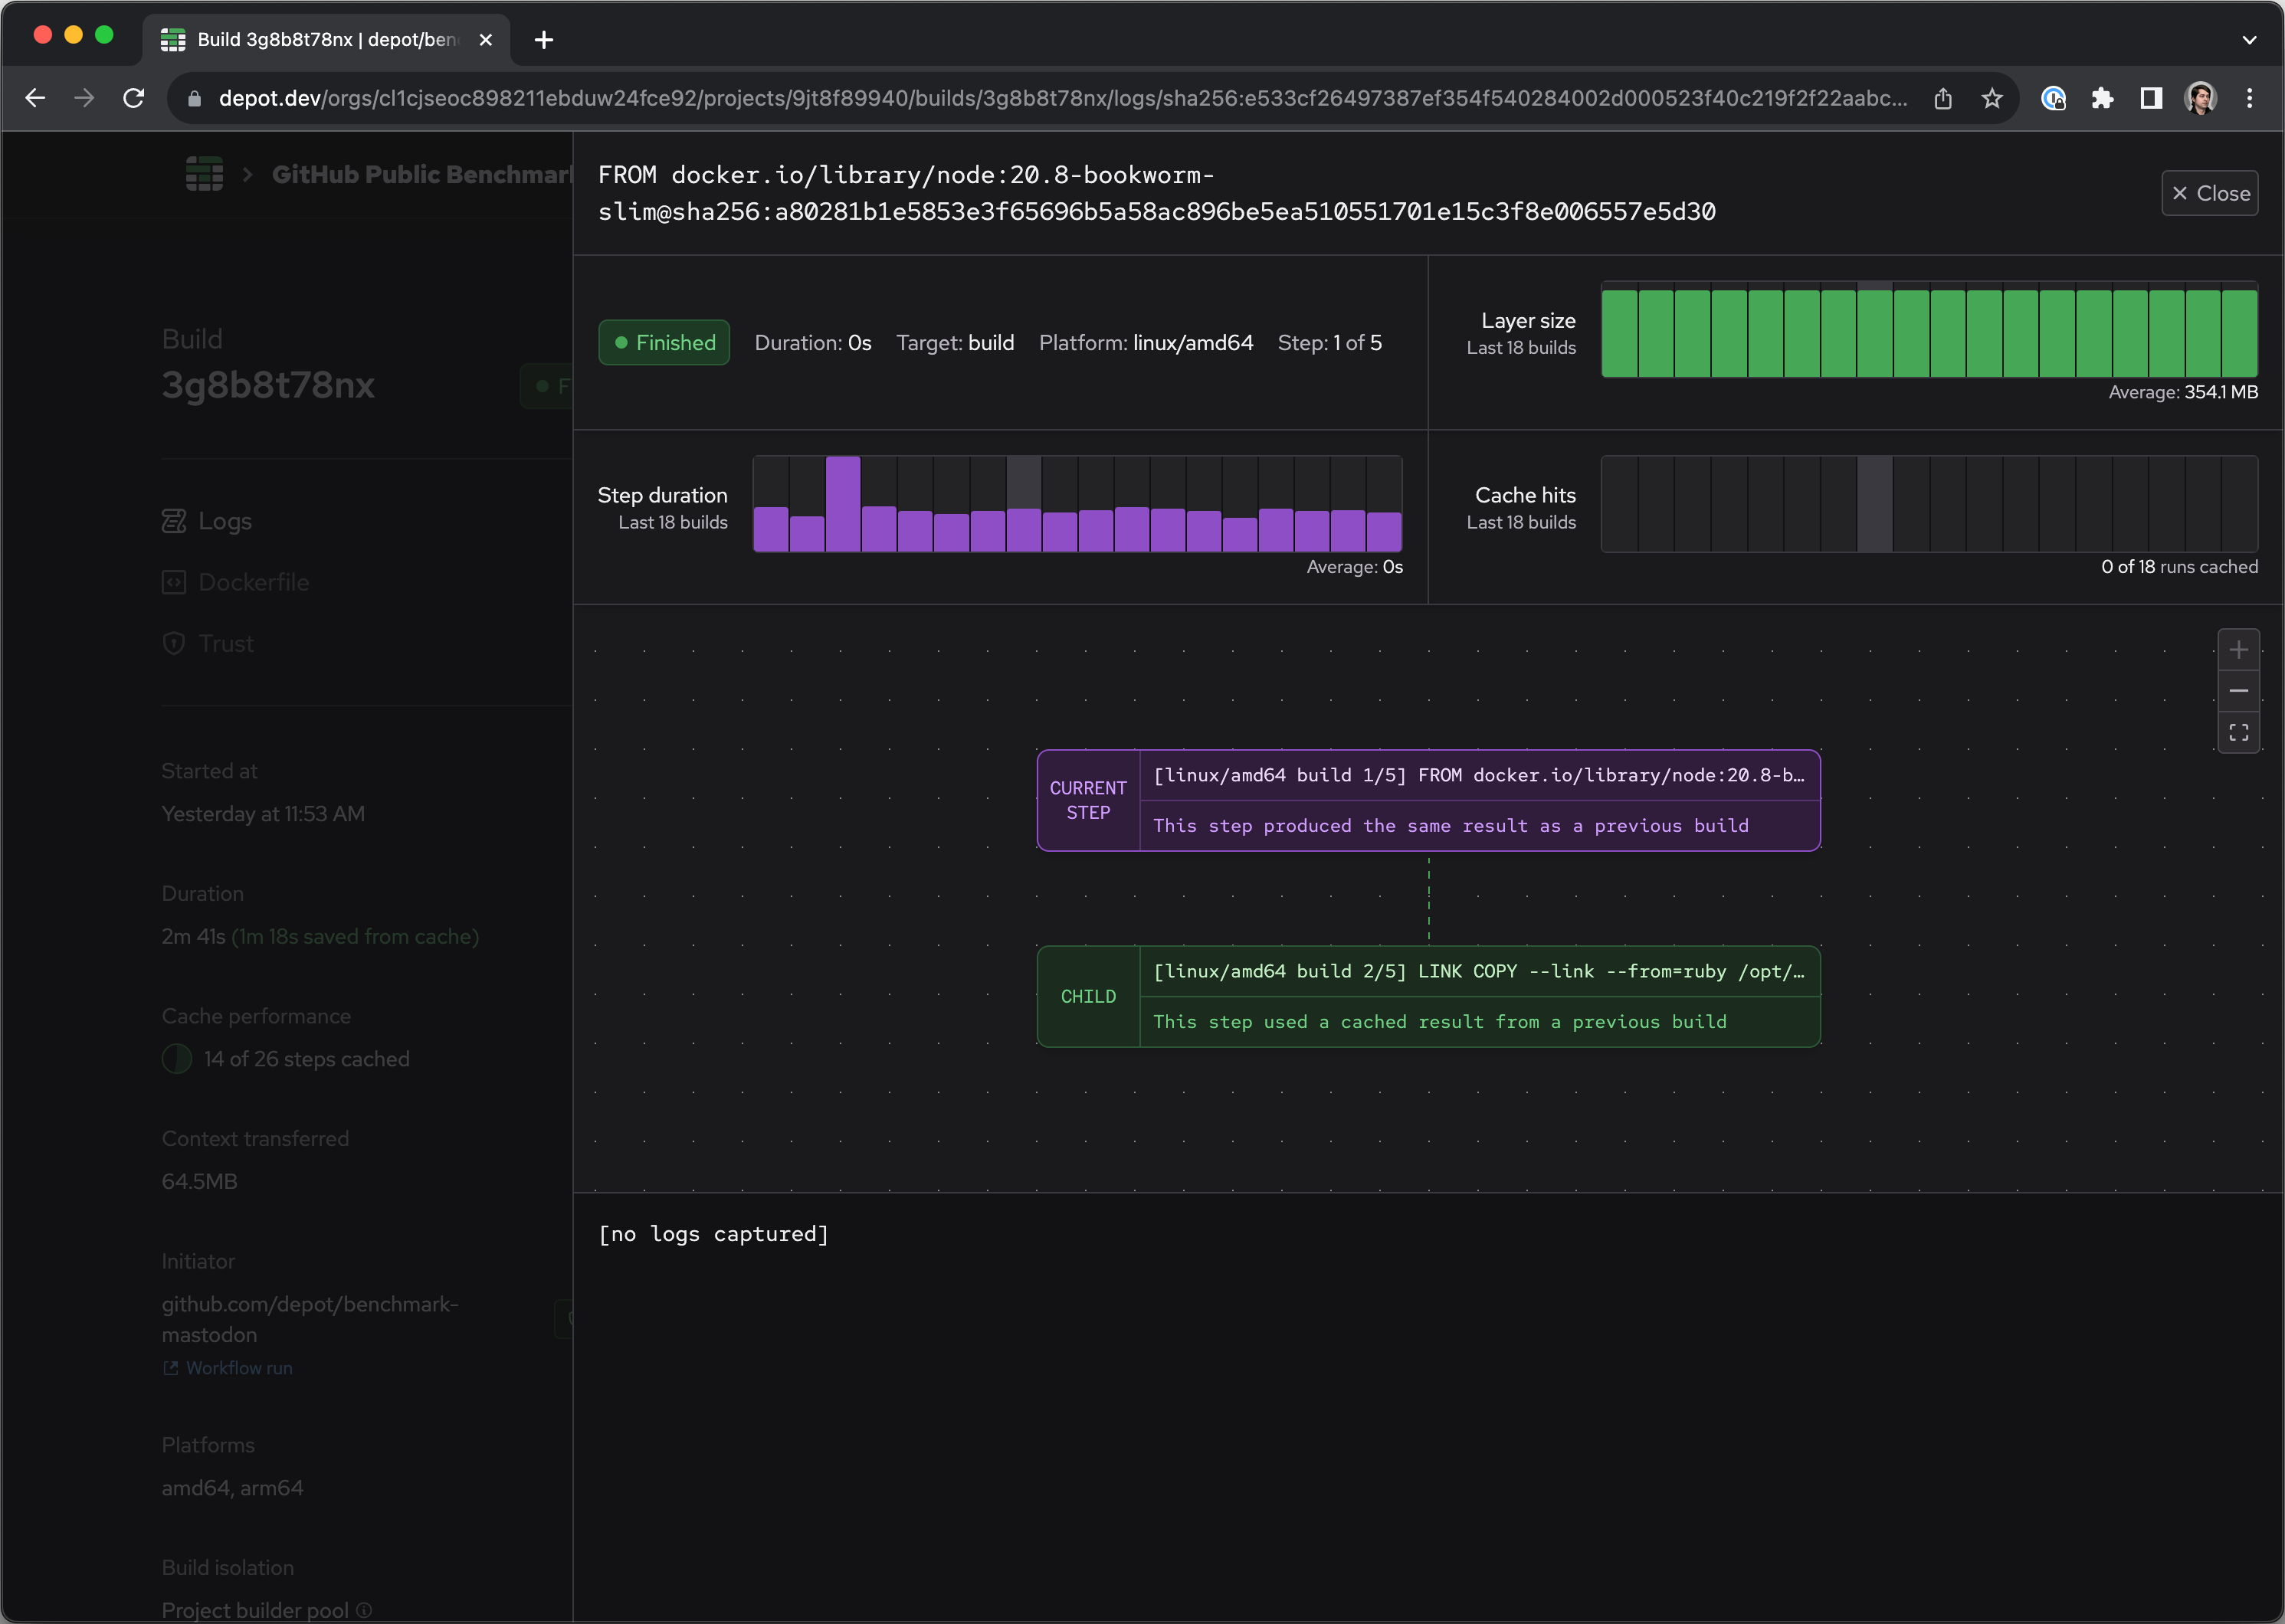
And here's a more nuanced example, where a build step was evaluated, but produced the same output as what was stored in cache, so its children were able to reuse the cached result:
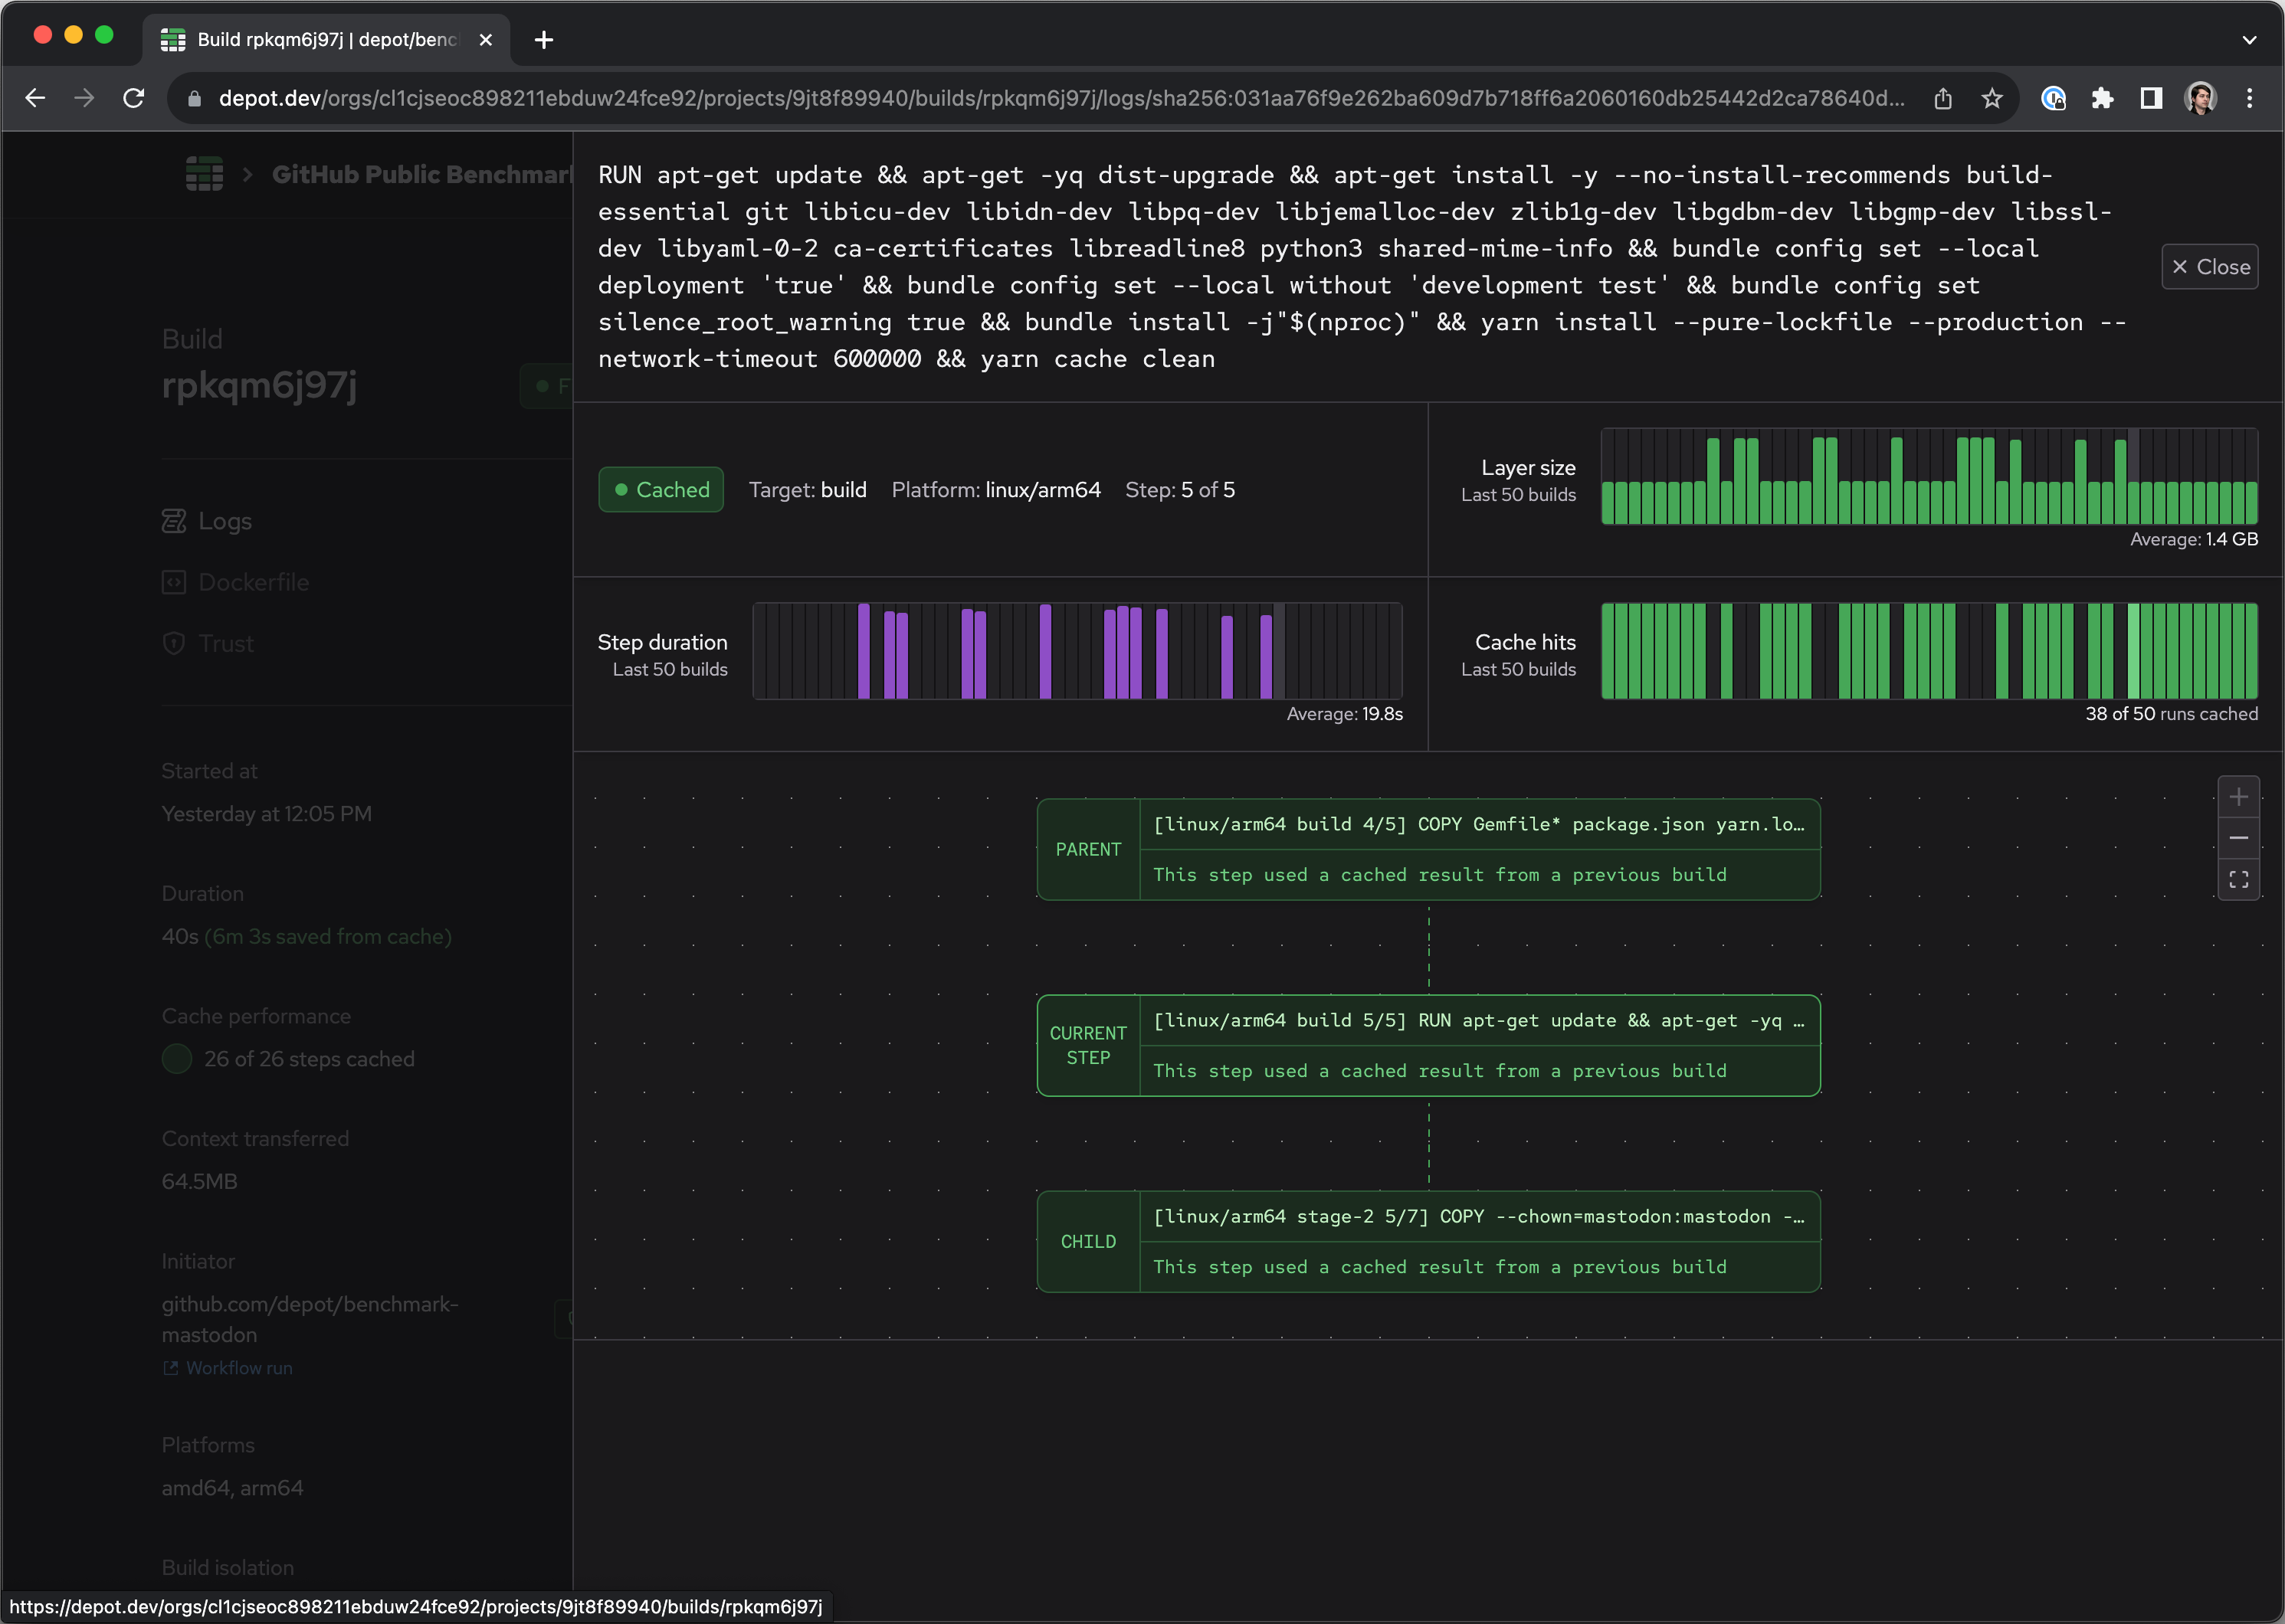
And finally, a fully-cached chain of build steps:
Dockerfile: what Dockerfile(s) were evaluated?
The Dockerfile view shows which Dockerfile or Dockerfiles that the build executed - in the case of builds with depot bake command, more than one Dockerfile may be used for the multiple build targets:
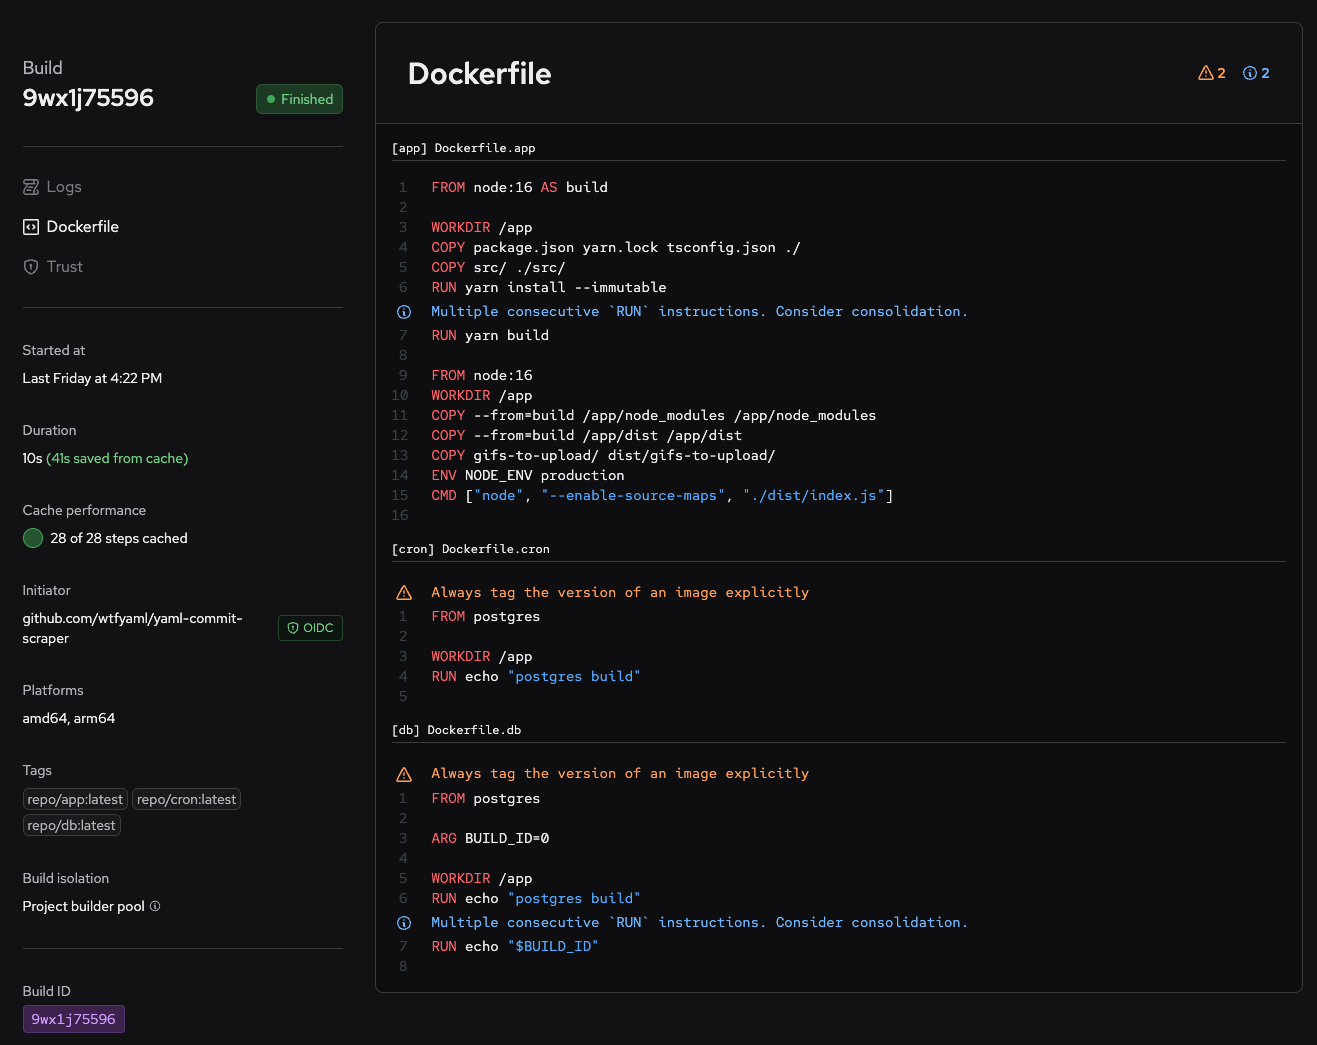
In addition to the file content, this view also includes suggestions about improving the Dockerfiles for better performance or security, powered by Depot's lint & build functionality — we automatically run the equivalent of --lint in the background for every build.
Trust: what invoked this build?
Finally, for builds invoked by OIDC trust relationships in GitHub Actions, CircleCI, or Buildkite, the Trust view surfaces that OIDC information:
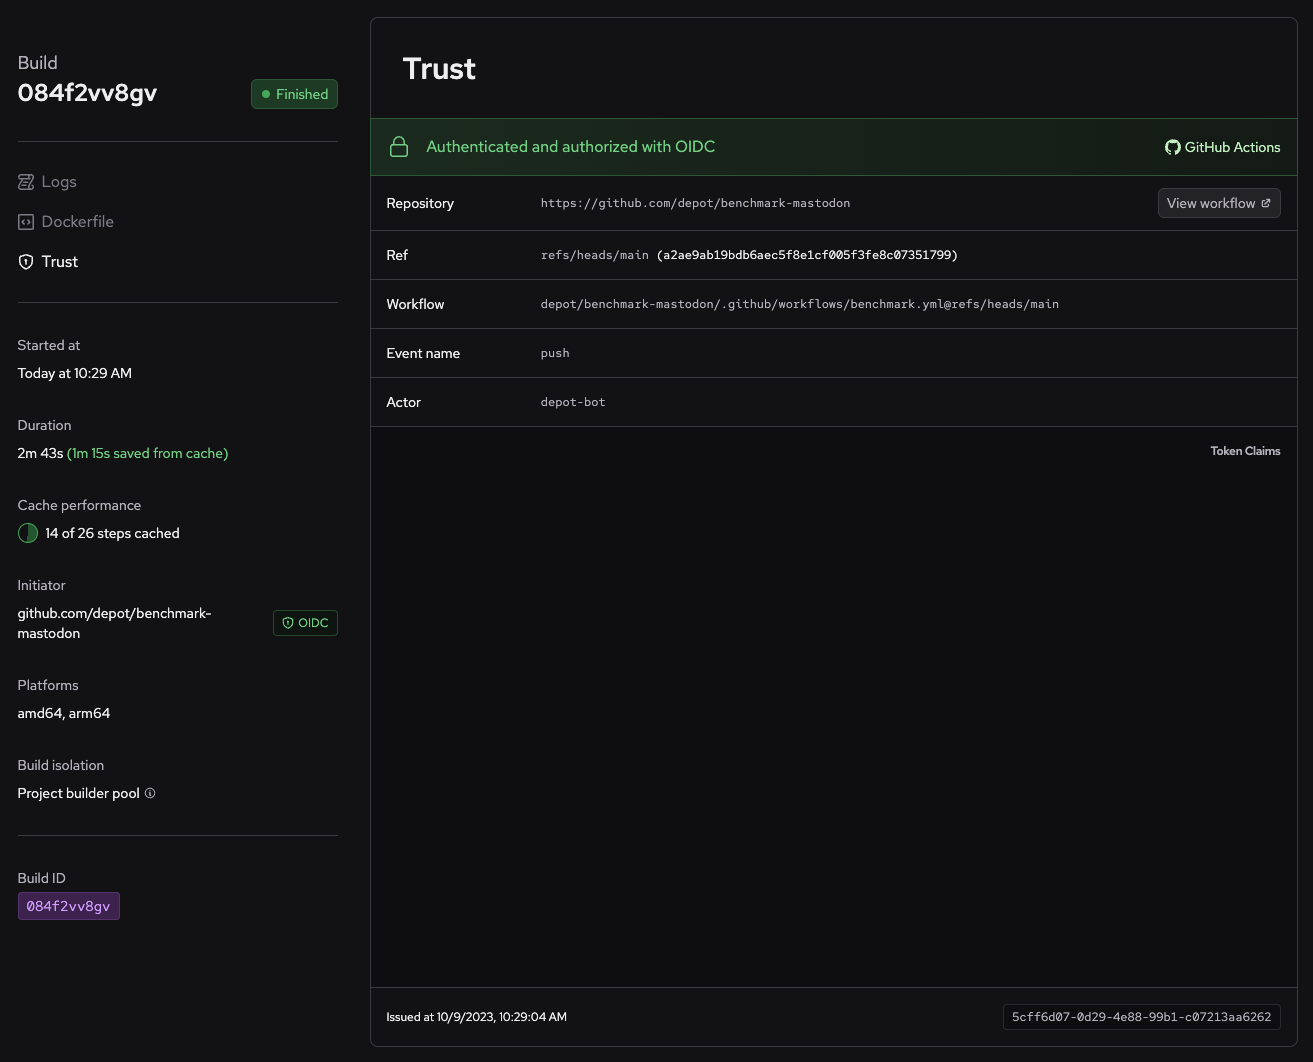
This view shows you what provider authenticated the build, the primary details about that authentication, such as repository, workflow, and commit, and the full token claims given by the provider's OIDC token. For GitHub Actions, you can also go directly to the workflow job that triggered the build with View Workflow!
We plan to expand the trust view with additional information about what initiated the build, even for non-OIDC builds.
Try it out today
We're very excited to be the first to bring this visibility into your builds. We're just getting started and have much more planned for the future. We'd love to hear your feedback and ideas on how we can make this even better. Pop into our Discord Community and let us know what you think.
To get started with Depot, you can sign up for free and get started today. If you're a Depot user, you can login and use the new build insights feature today.
