Engineers and agents produce a lot of CI activity. Runs start, pass, fail, and retry across pushes, pull requests, schedules, and manual dispatches. When something needs your attention, you want to know what ran, what failed, and where to look next.
Depot CI captures lots of information about a run, from job timelines and logs to CPU and memory metrics to a plain-language diagnosis when something fails. To help you quickly find what you need and act, we are building a set of connected surfaces and intelligent affordances around that data. To start, you can follow workflow runs as they happen, open any run to see exactly what it did, and browse activity by repository and workflow definition.
Follow recent runs
The Runs tab is the live activity view for Depot CI, a feed of what your org is working on.
It shows recent workflow runs across your repositories and lets you filter by properties like repository, status, trigger, and commit SHA. When you open a run from this view, your filters persist and the runs stay visible so you can work through a list without losing your place.
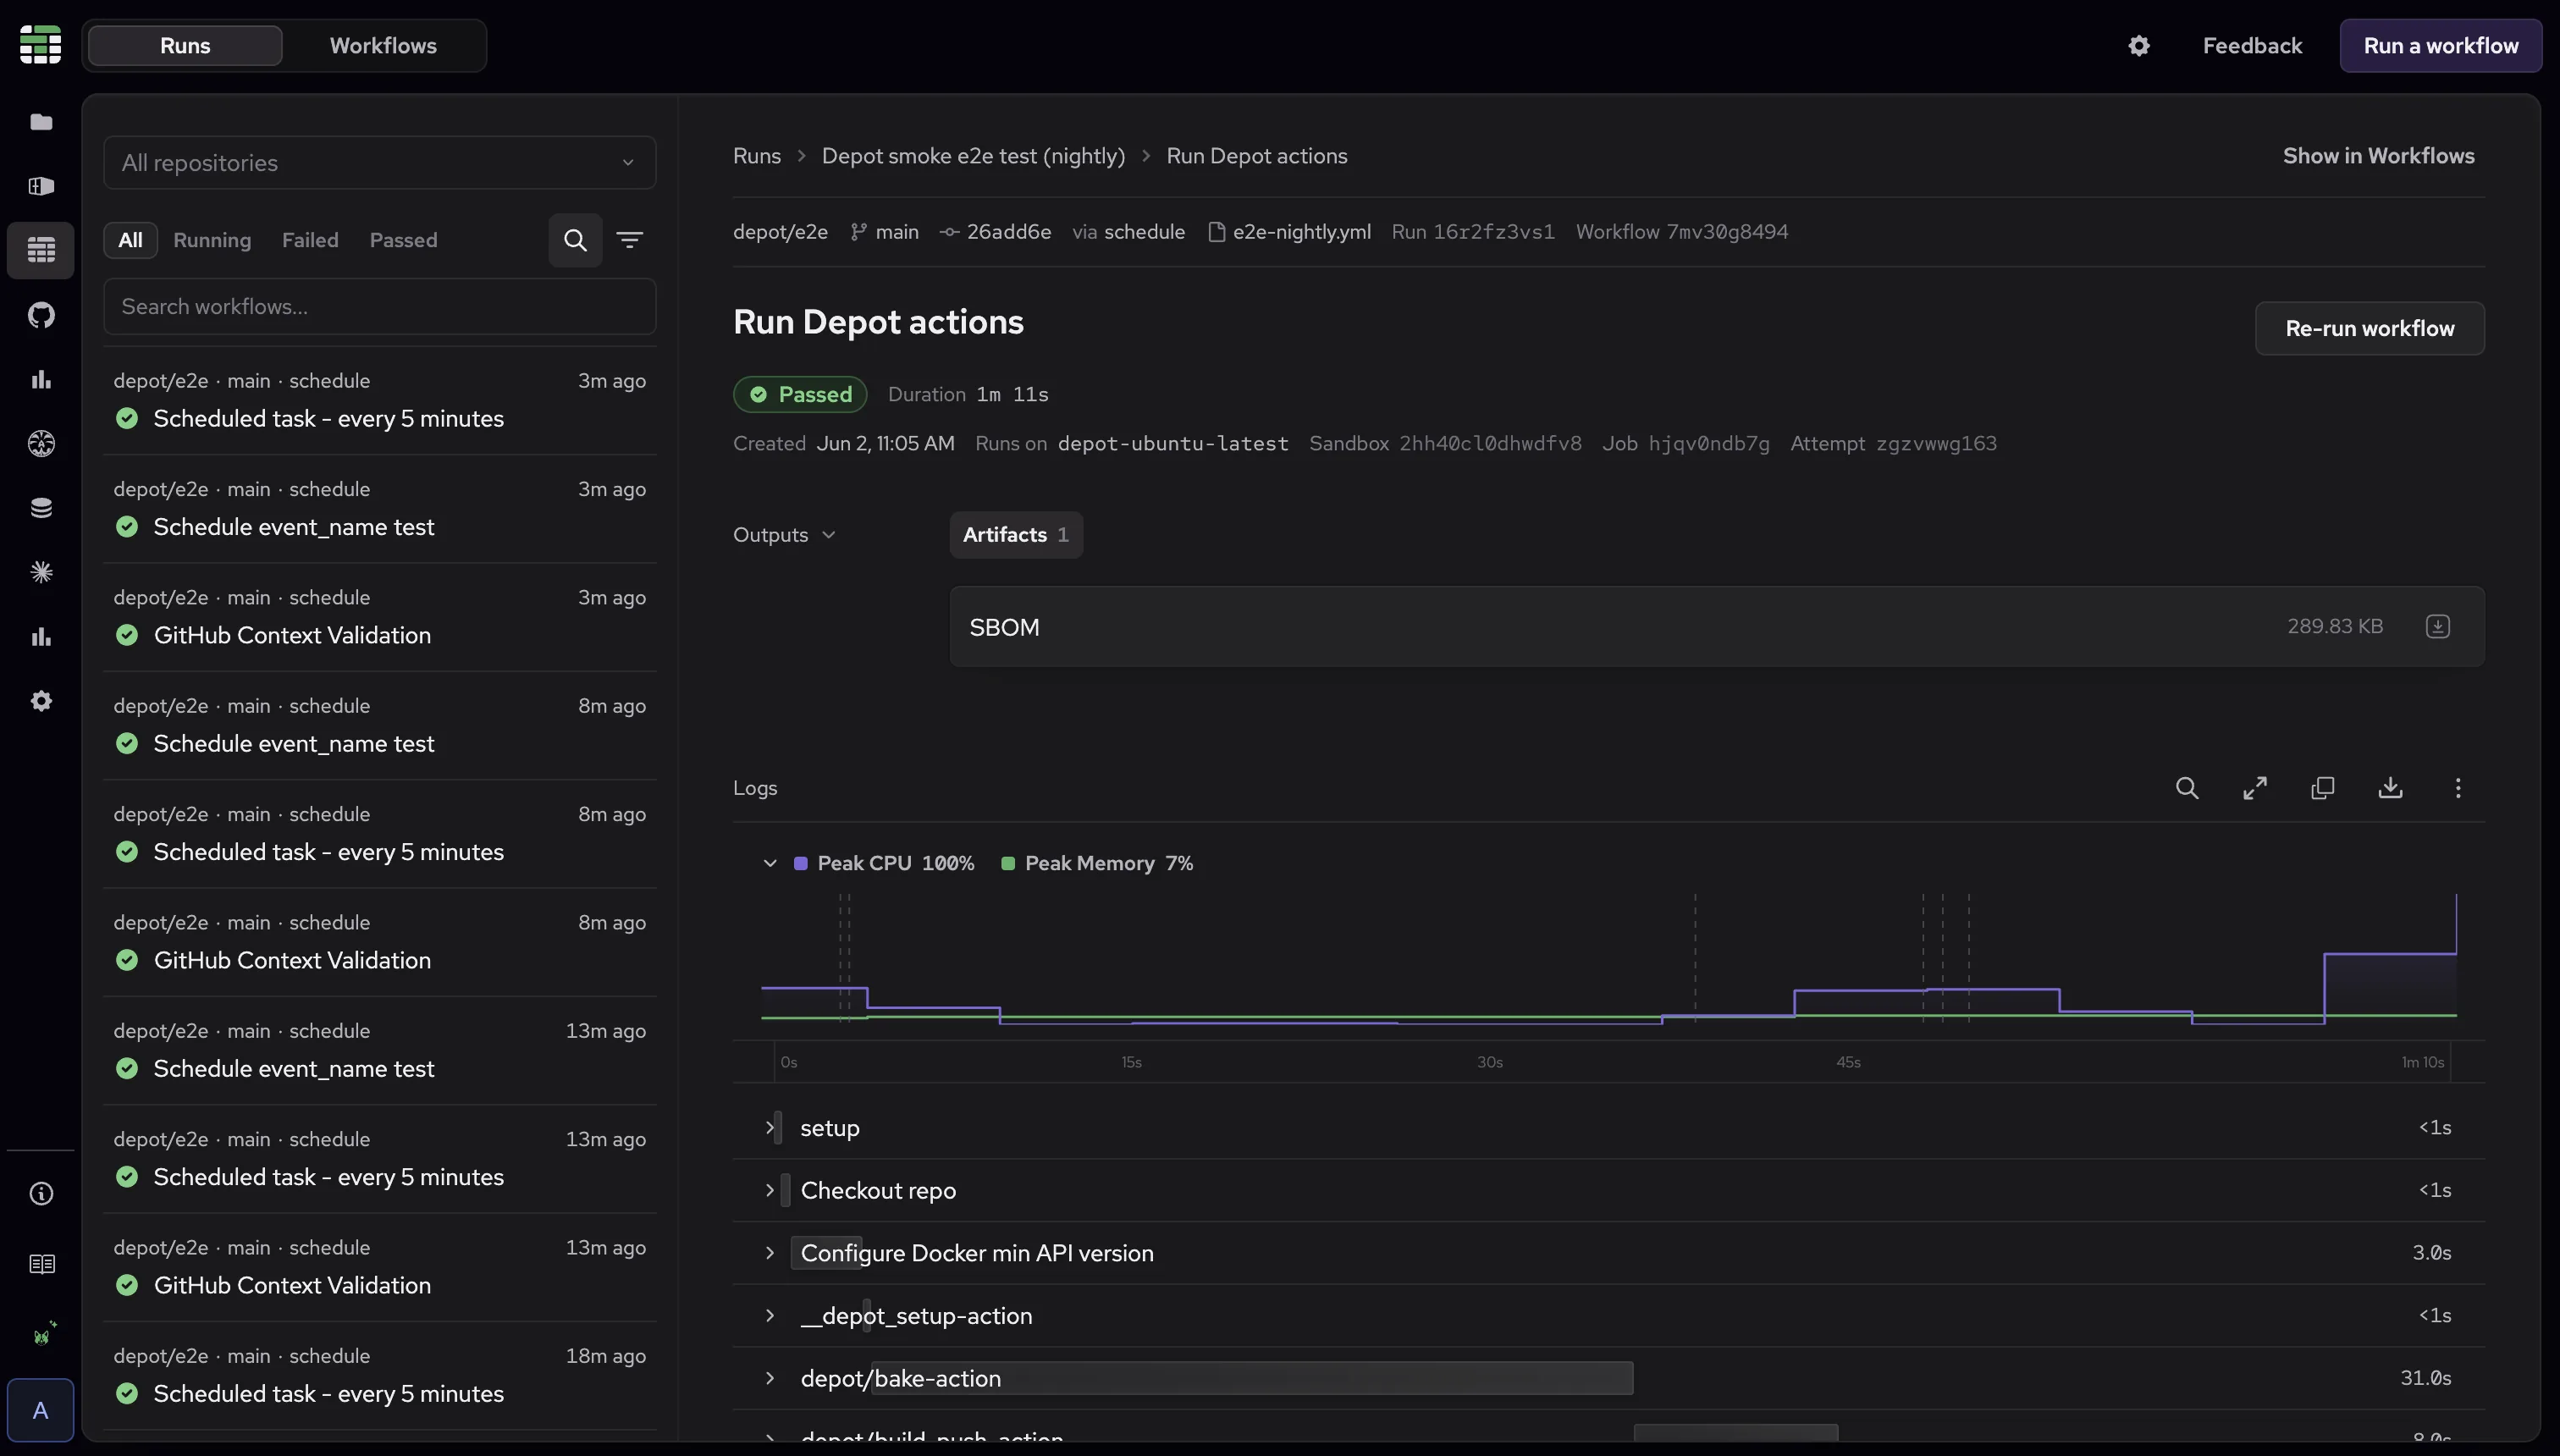
Open any run to get the full picture with run context, overall results, and a job timeline across the entire workflow. When a run fails, the summary points you to the cause along with a suggested fix to try. When several jobs fail in the same way, the run groups them together for you instead of repeating one failure many times. That keeps matrix jobs readable. A single broken step shows up once, even when it fans out across shards or environments.
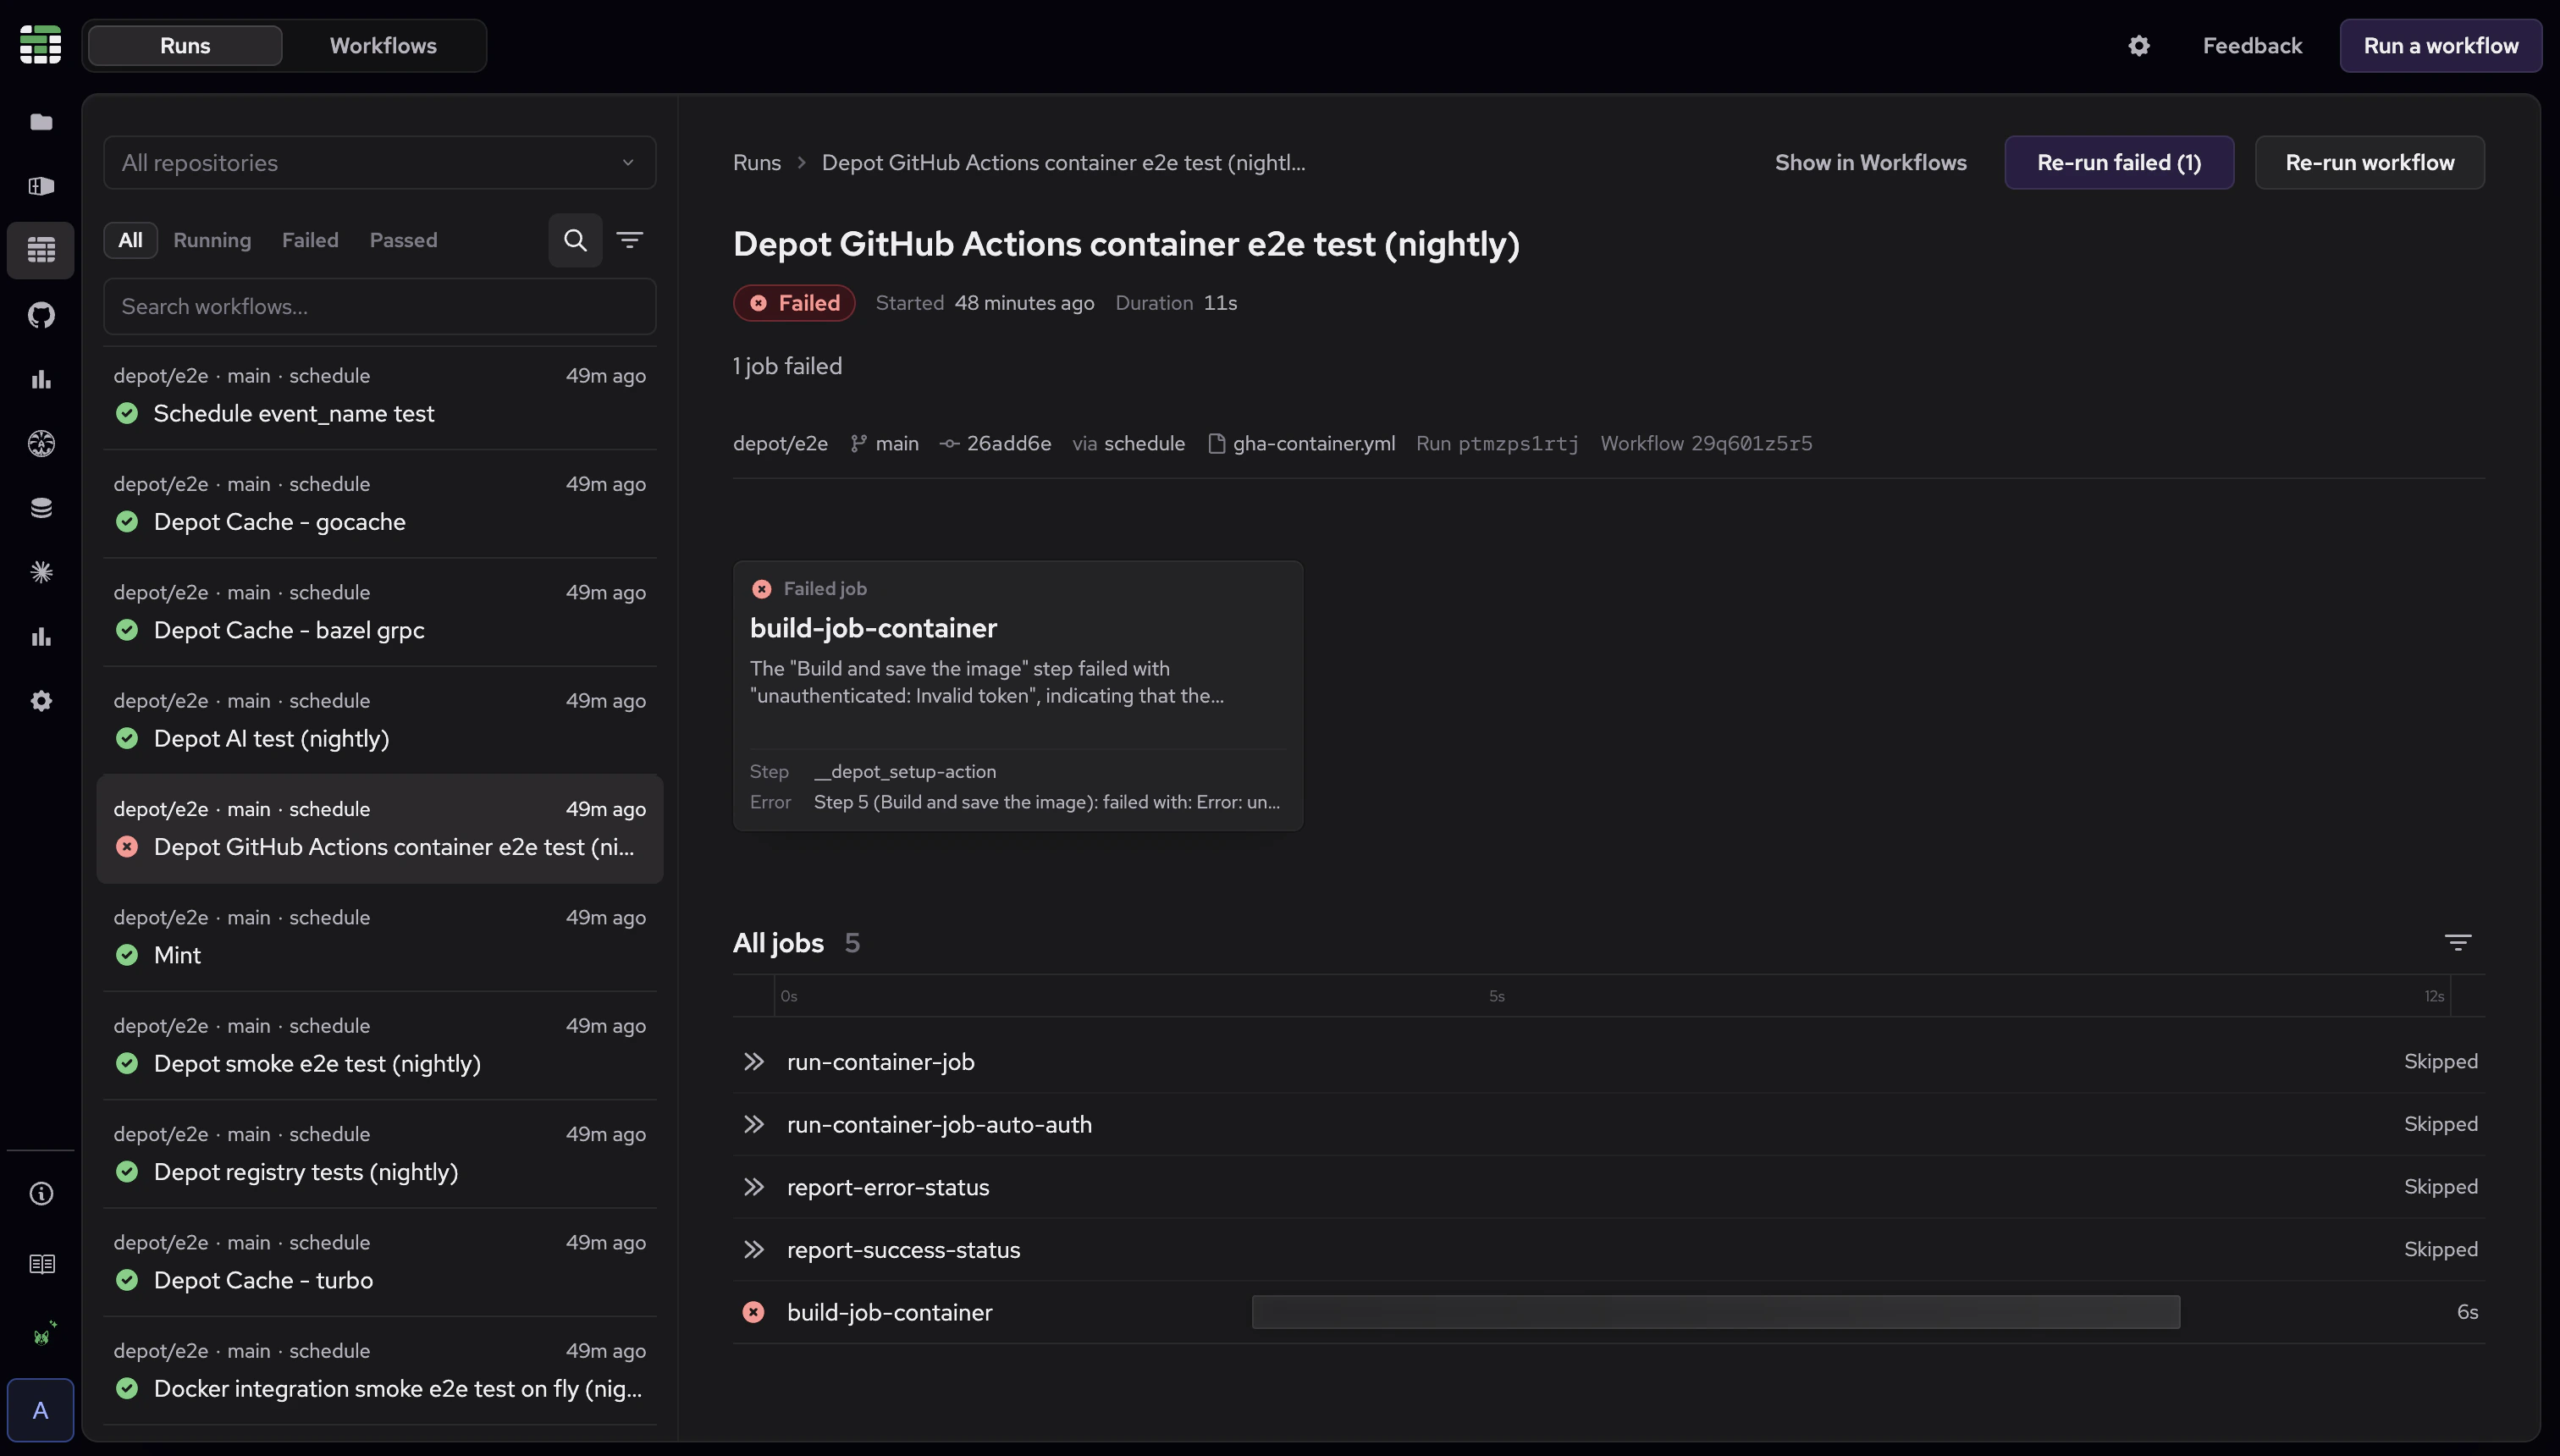
From there you can dig into specific jobs to read the full logs, view CPU and memory metrics, compare attempts, and retry. You can SSH into the sandbox running the job to inspect the environment directly, or Ask Sherlock to investigate the failure in context. Job outputs like summary data, test results, and assets are surfaced on a collapsible shelf for easy access.
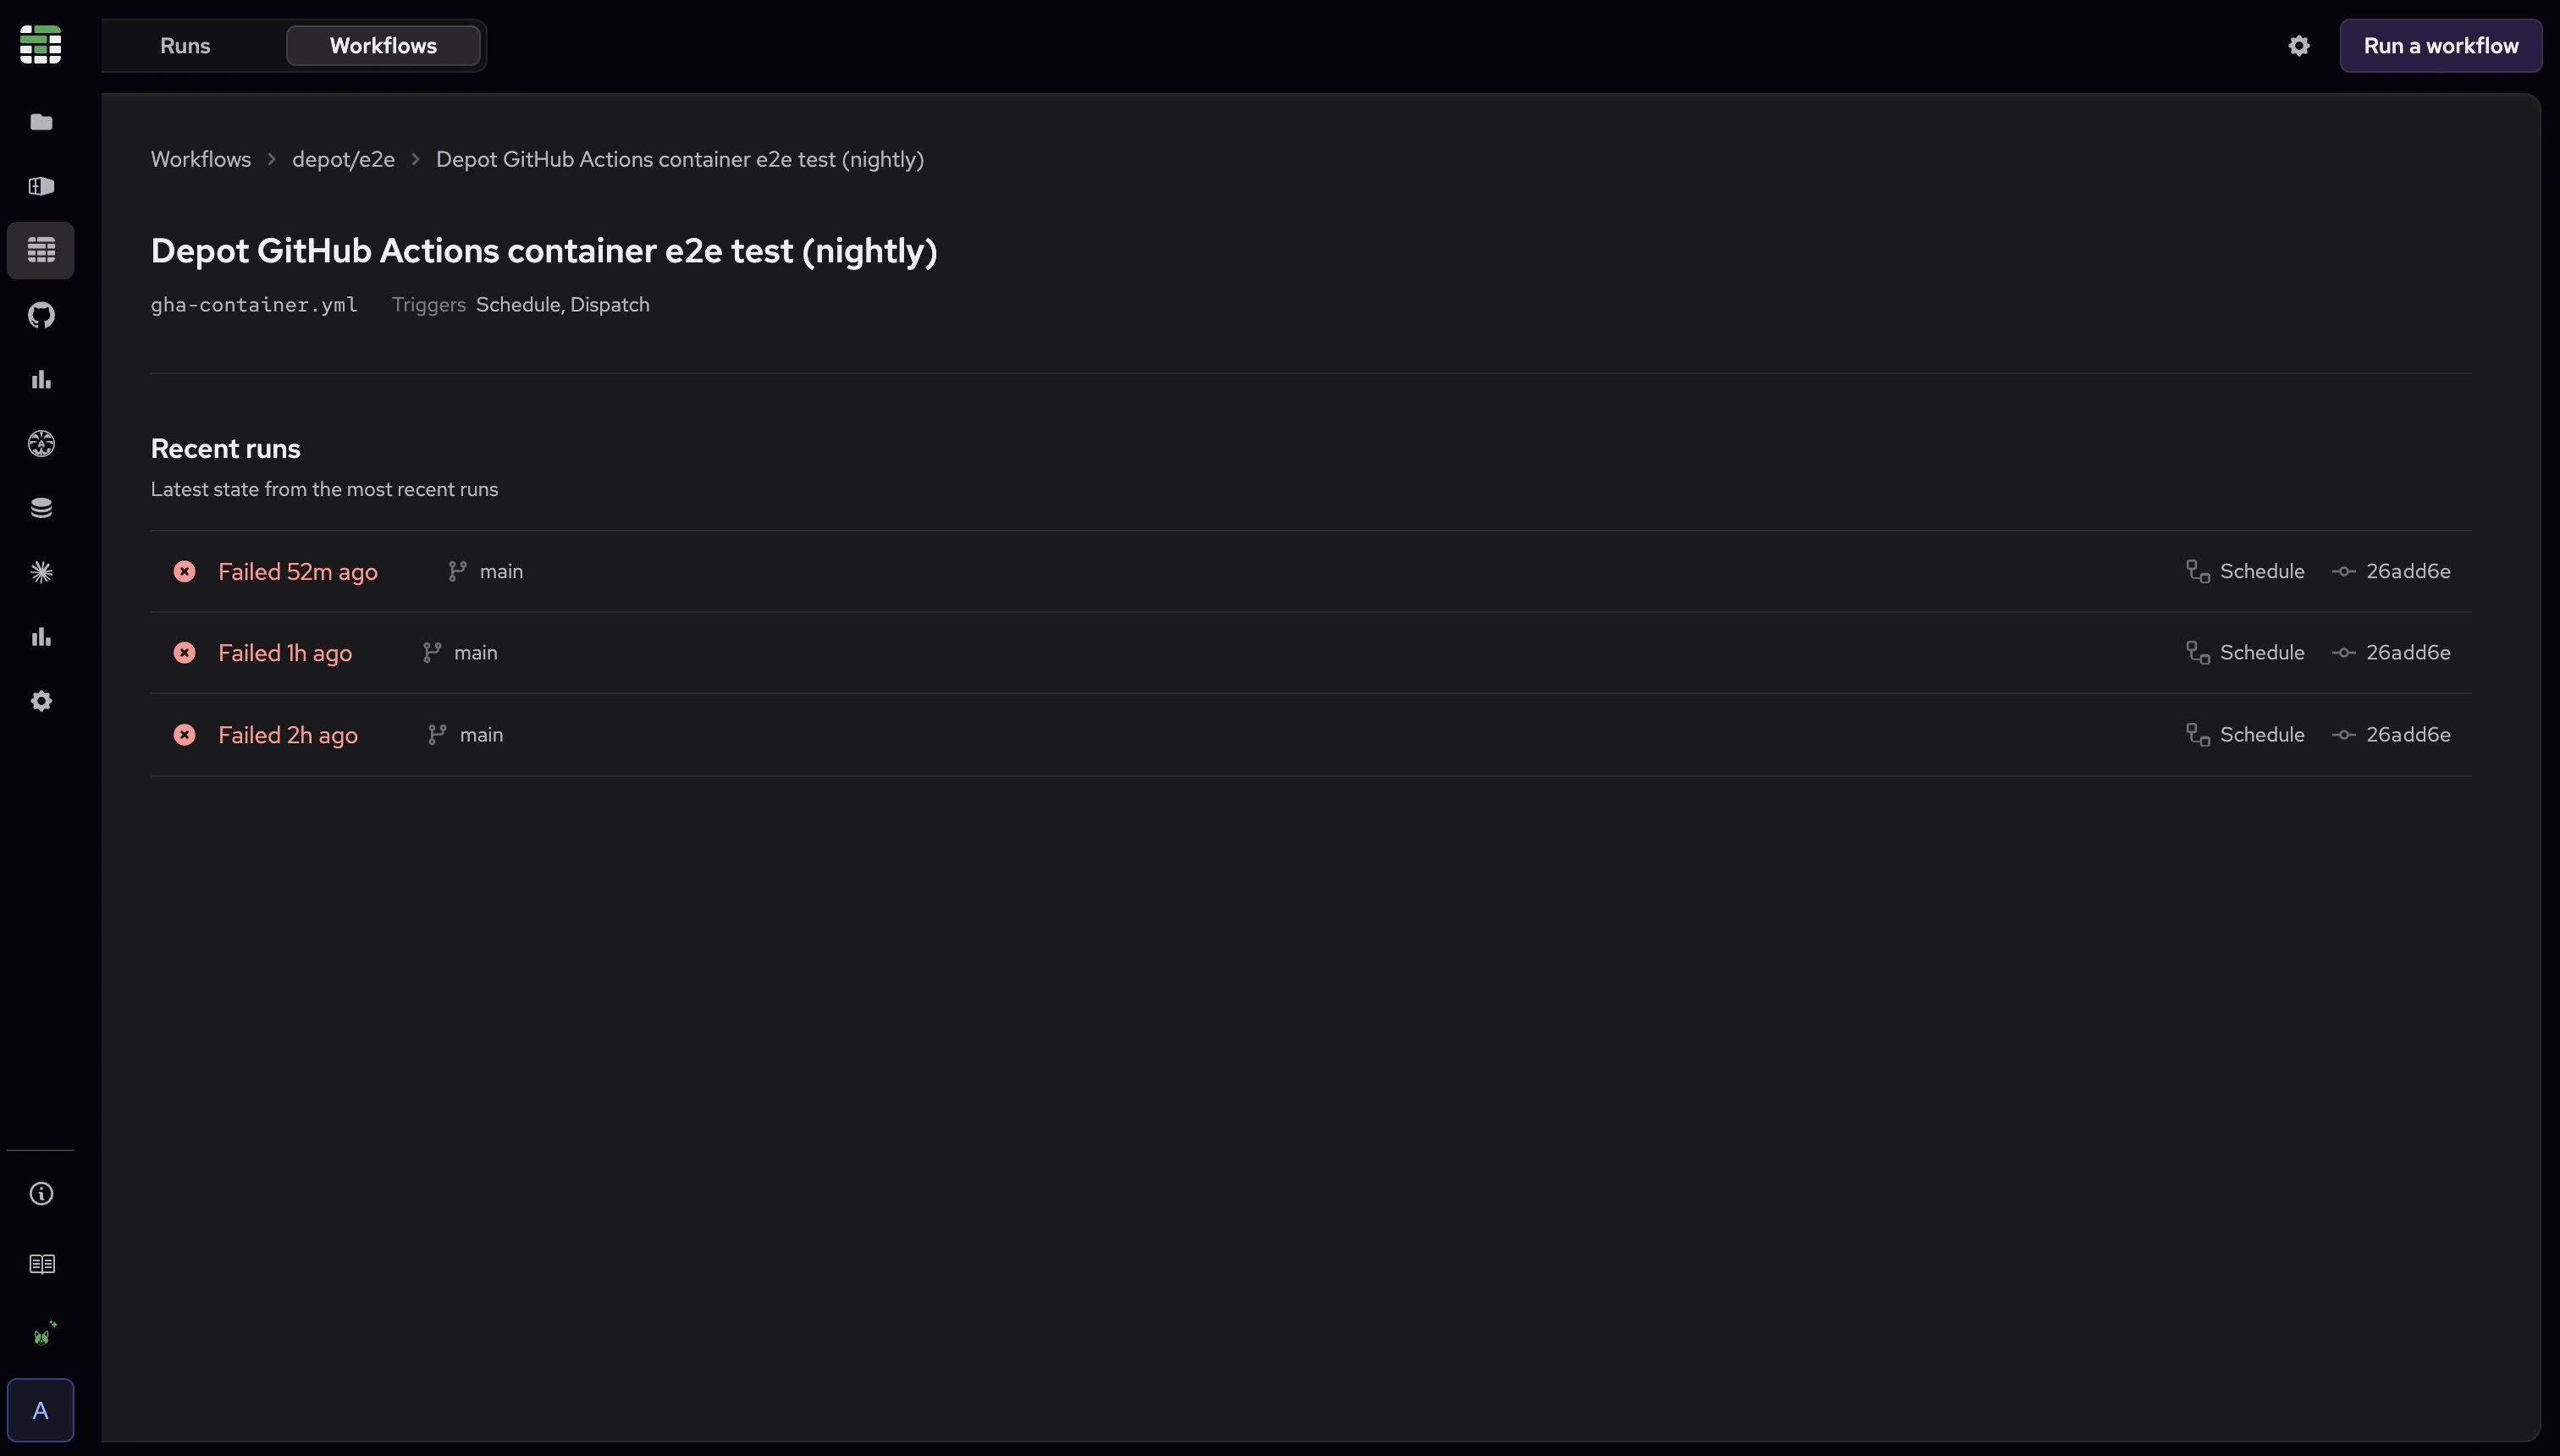
Browse by repository and workflow
The Workflows tab starts from your repositories instead of the run feed.
Open a repository to monitor the workflows it runs, including their latest status, recent failures, and current activity. If you prefer, you can focus on a specific branch.
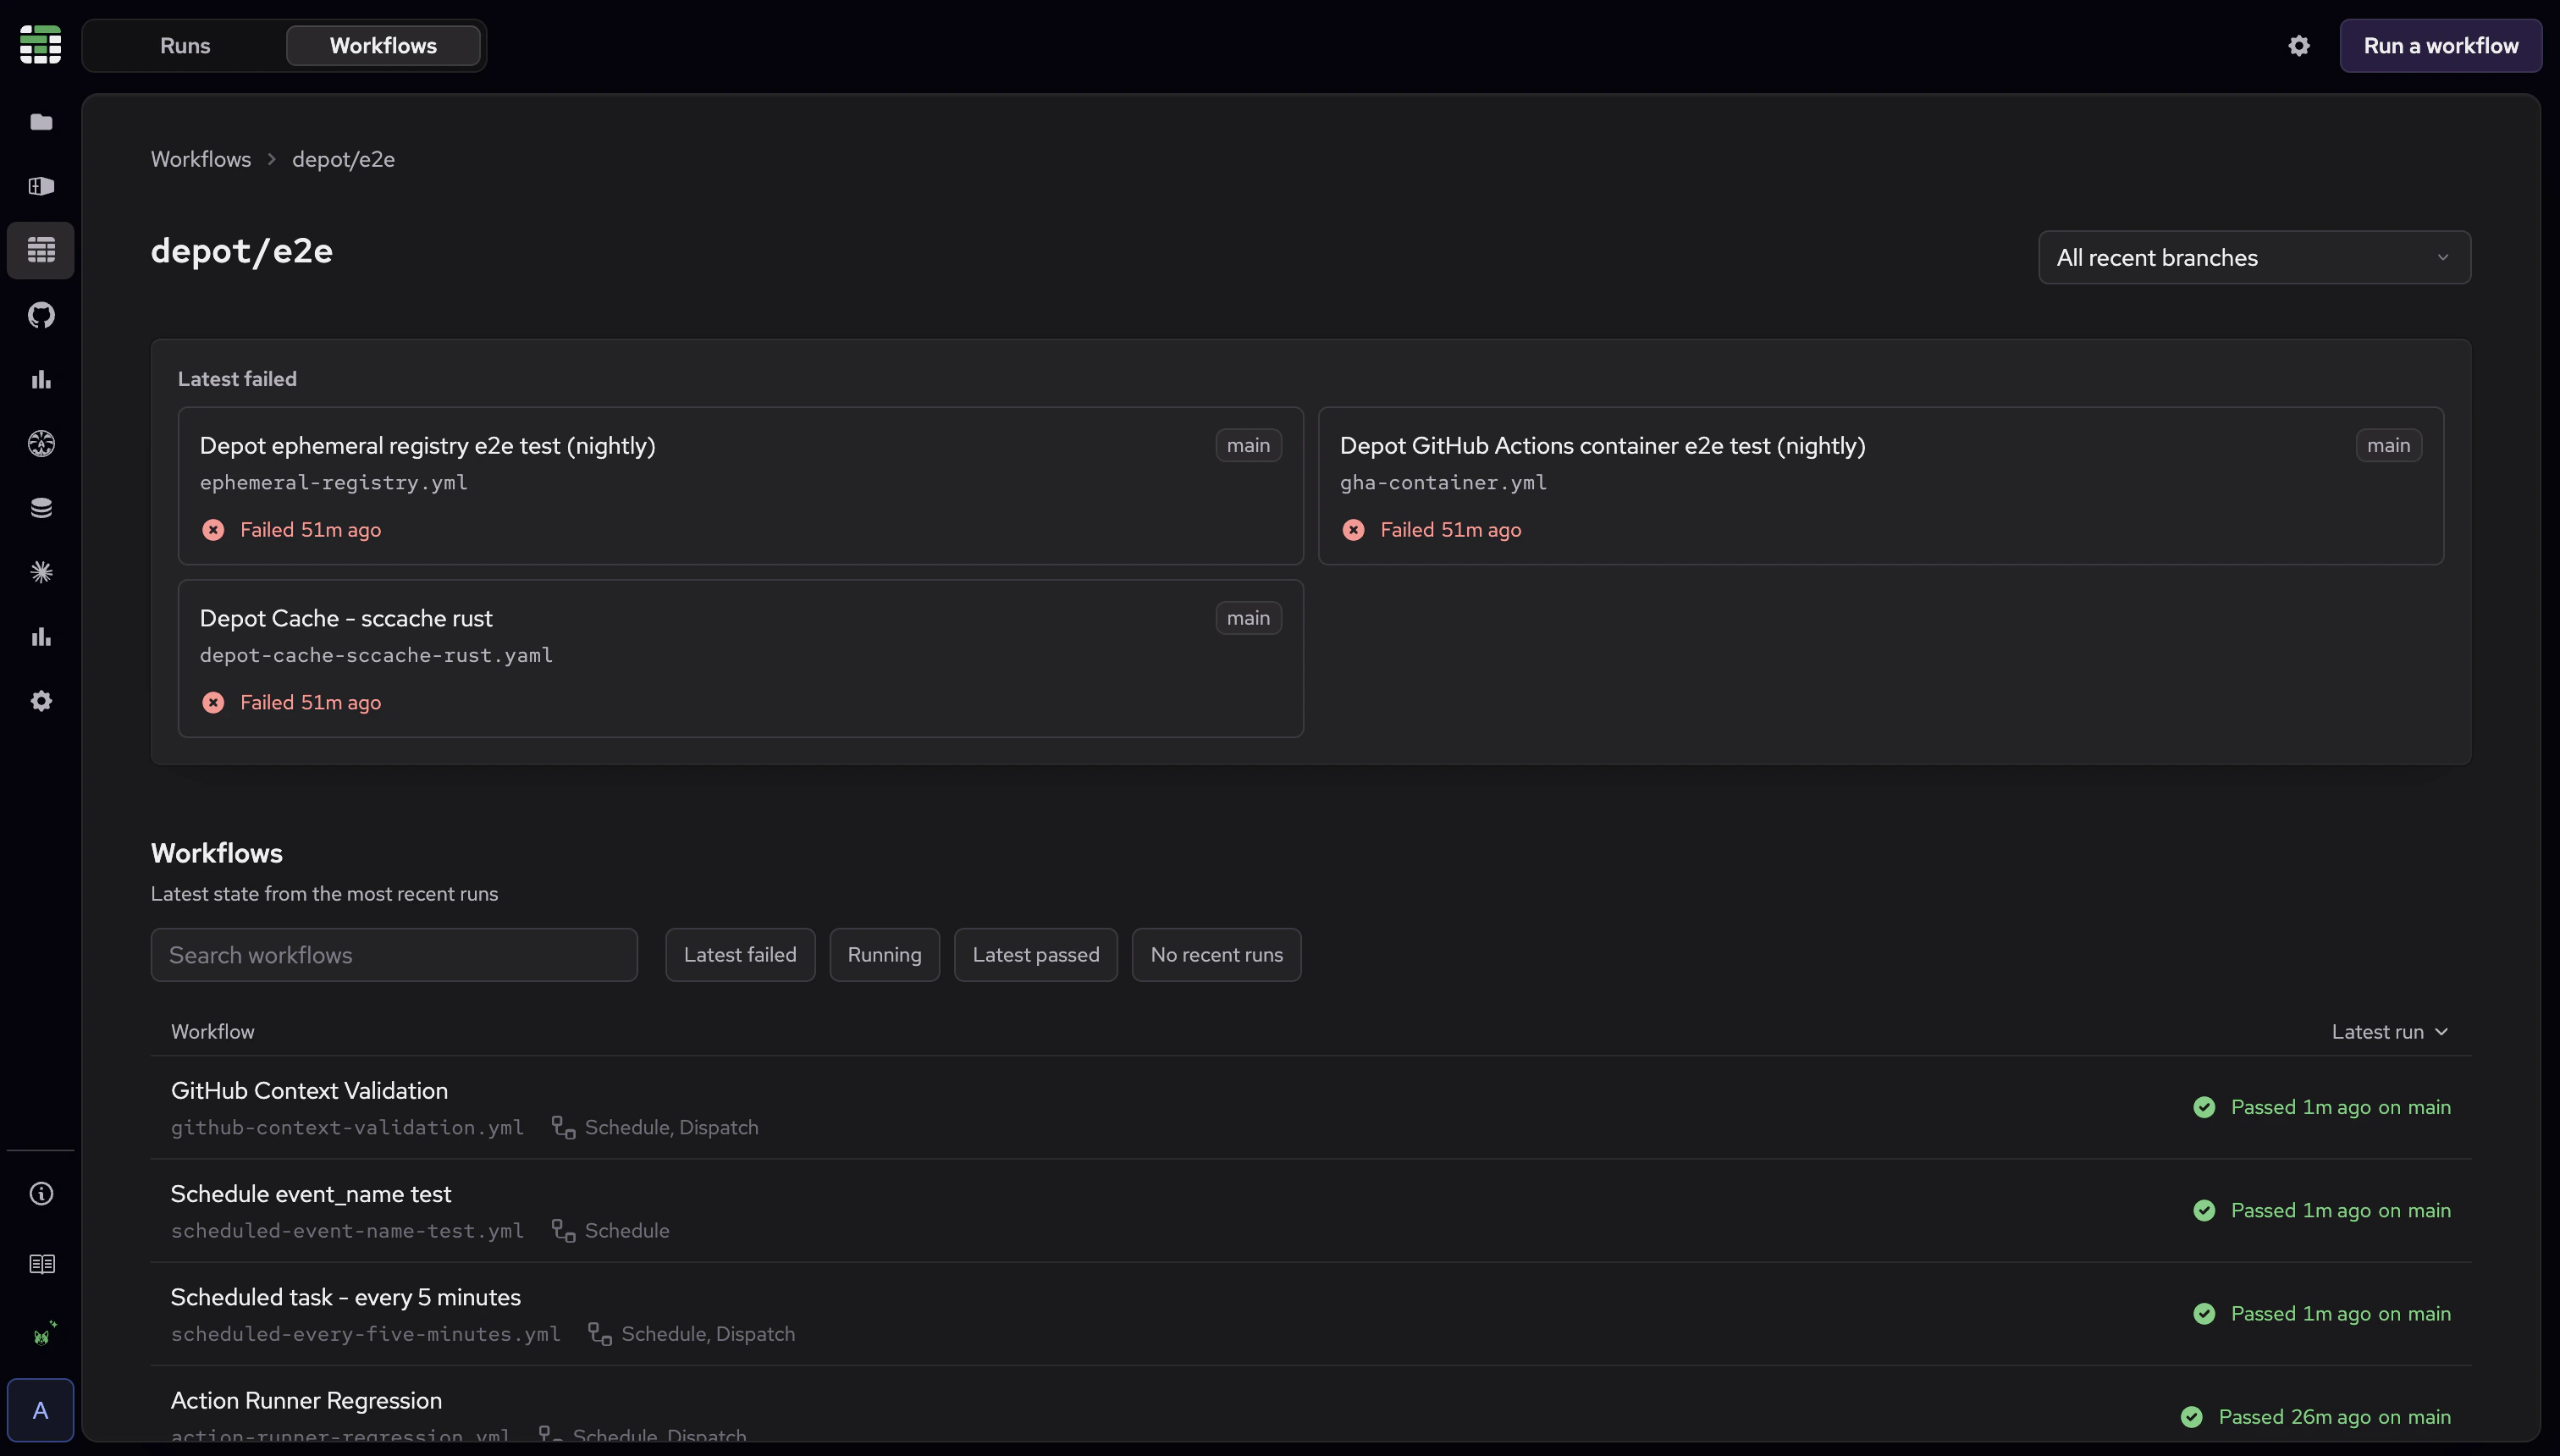
Then open a workflow to inspect its recent runs.
These views stay connected. From a run, you can jump to the workflow behind it; from a workflow, you can open any run it produced. That lets you move from recent activity to a specific failure and back to the workflow it came from without rebuilding the context yourself.
Watch an agent work
Depot CI is the programmable CI engine for both engineers and agents. An agent can use the CLI to run fixes against a failing workflow and iterate until CI is green. Instead of waiting for the agent to report back, you can use the Depot CI dashboard to watch it converge in real time to a passing run. The agent works through the CLI, and the dashboard is your window into what it's doing.
Get started
Open Depot CI in the dashboard. If you're already running Depot CI, there's nothing extra to set up.
Use the Runs tab to follow and filter recent executions, and the Workflows tab to browse activity by repository and workflow. New to Depot CI? Start with the Depot CI overview or the quickstart.
Next steps
These initial Depot CI views are built for day-to-day CI triage. Both the Runs and Workflows tabs are based on the latest runs, so they highlight what's active now.
We're working on features to surface trends and explore analytics next, and we'd love to hear what would be most useful to you. Reach out through support or join our Community Discord to share what you'd like to see.
Related posts
- Now available: Depot CI
- The end of push-wait-guess CI
- Now available: Sherlock can analyze Depot CI workflows and jobs
