
Depot has scaled from tens of individual builds to tens of millions of builds happening every single week across the platform. With that scale comes new feature requests from thousands of new organizations looking to get faster builds.
But at that scale, we have to balance developing new features with revisiting previous decisions and systems that aren't as performant and scalable as they used to be. Everything is an iteration that was built for a point in time that was meant to scale to another point.
We've been revisiting a lot of these types of systems internally to see where we need to further scale. We're going to make this a regular series on our blog to share the new things we're building and learning as we scale to meet the demand of the thousands of organizations that are trusting us with their builds.
The thundering herd
This first post in the series focuses on what we call "the thundering herd problem". It arises when upstream systems outside of our control experience issues. These problems cascade downstream and affect our ability to launch runners for GitHub Actions or container image builds.
Some examples of where pressure is put on our systems from upstream issues:
- Capacity issues for Amazon EC2 in a given region or availability zone
- Region outages that impact the EC2 API
- GitHub outages that prevent jobs from being delivered down to runners Our system attempts to retry so we can continue to run builds and jobs in a timely manner. But when the upstream problem is ongoing, this demand can build up rather quickly. This growing group of retries and new attempts is what we refer to as the thundering herd.
There are multiple facets of the thundering herd that require addressing. The two main ones are:
- Applying some backpressure into the system to lower demand during these times
- Ensuring the system has the capacity to handle this higher demand (which will be needed as we scale anyways)
This post focuses on handling higher demand, specifically around our database.
Handling higher demand
During a thundering herd event, what would normally be manageable database traffic suddenly spikes. We've seen CPU usage jump to 100%, which cascades into a much larger problem. Some key components of our system rely on the database, so when it's struggling, the impact to other parts of our system may grow.
We use PlanetScale for database management and we use their dashboards and insights to monitor the state of the DB. PlanetScale exposes metrics that help us understand what's happening with our database in real time. When issues arise, we can check the CPU metrics dashboard to see if we're hitting database constraints. Since the database is a critical point of failure, catching these spikes early is essential.
The Insights page is particularly valuable. It surfaces:
- Which queries are consuming the most CPU time
- Query latency distributions (p50, p95, p99)
- Queries that are scanning excessive rows
- Lock contention on specific tables
Utilizing metrics exposed during thundering herd events, we're able to quickly identify which queries are contributing the most to load and prioritize optimization work accordingly.
Some optimizations we've made
Queries without indexes
First, we systematically went through all the queries we perform against PlanetScale and looked for the ones without indexes. PlanetScale makes this task easy: those queries are highlighted on the Insights page (indicated by the exclamation point icon).

Not all queries need to use an index. It really depends on the frequency of the invocation, and the volume of data it operates on. It's also a trade-off between latency and memory usage. That being said, we identified all the low hanging fruit and added indexes where it made sense.
Optimizing existing indexes
PlanetScale has a "Recommendations" page, where among other things, it recommends adding or deleting indexes. Sometimes this page has great recommendations, but those are not always silver bullets.
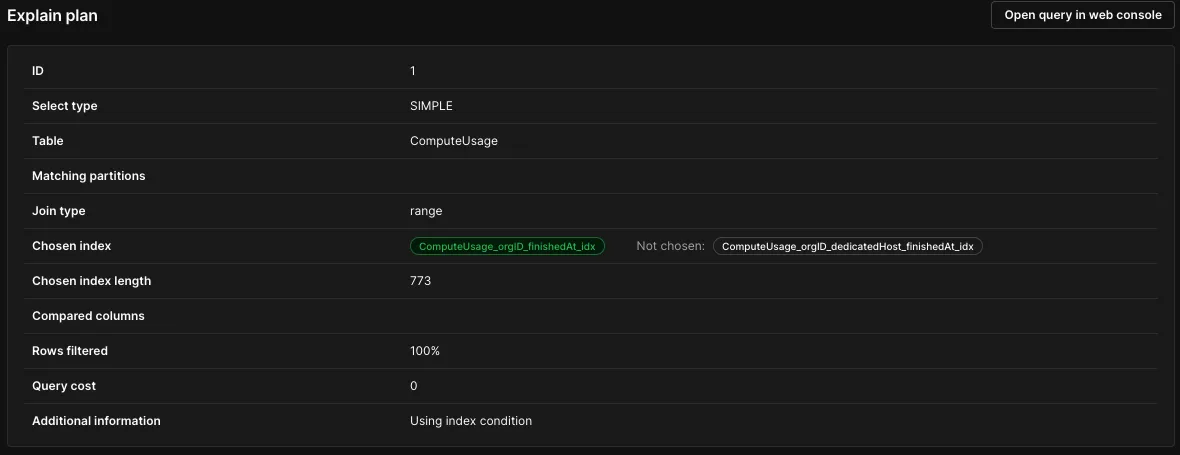
One other good indicator of missing or lacking indexes is taking a look at the Insights page and identifying queries with high p50 (and even p99) latencies. Again, this isn't always possible playing a game of trade-offs, but a good p50 query latency should stay below 100ms. To drill down, one can always run an "EXPLAIN ANALYZE" against the query, or use the "Indexes" tab to see which indexes are being selected for a particular query. When a query is taking more than 1s to run, PlanetScale provides an "Explain" page for the given invocation which reveals an even more detailed breakdown.
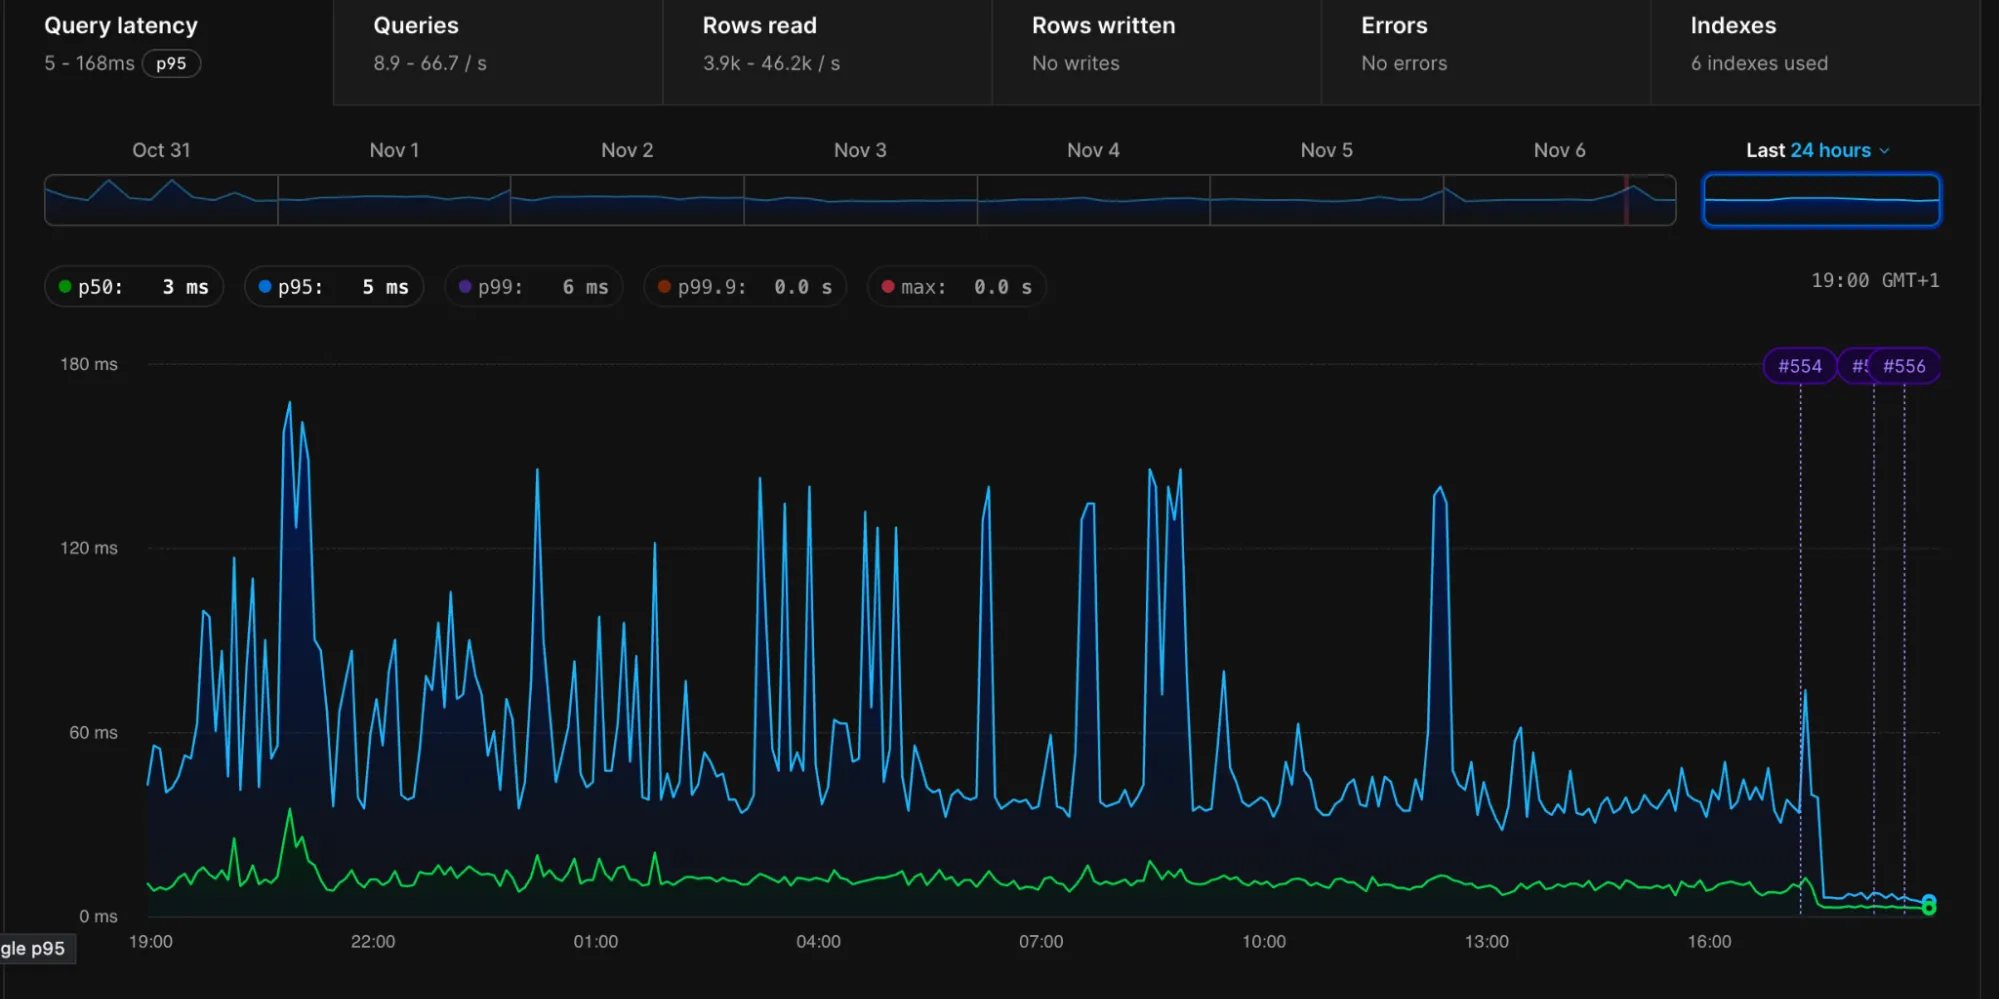
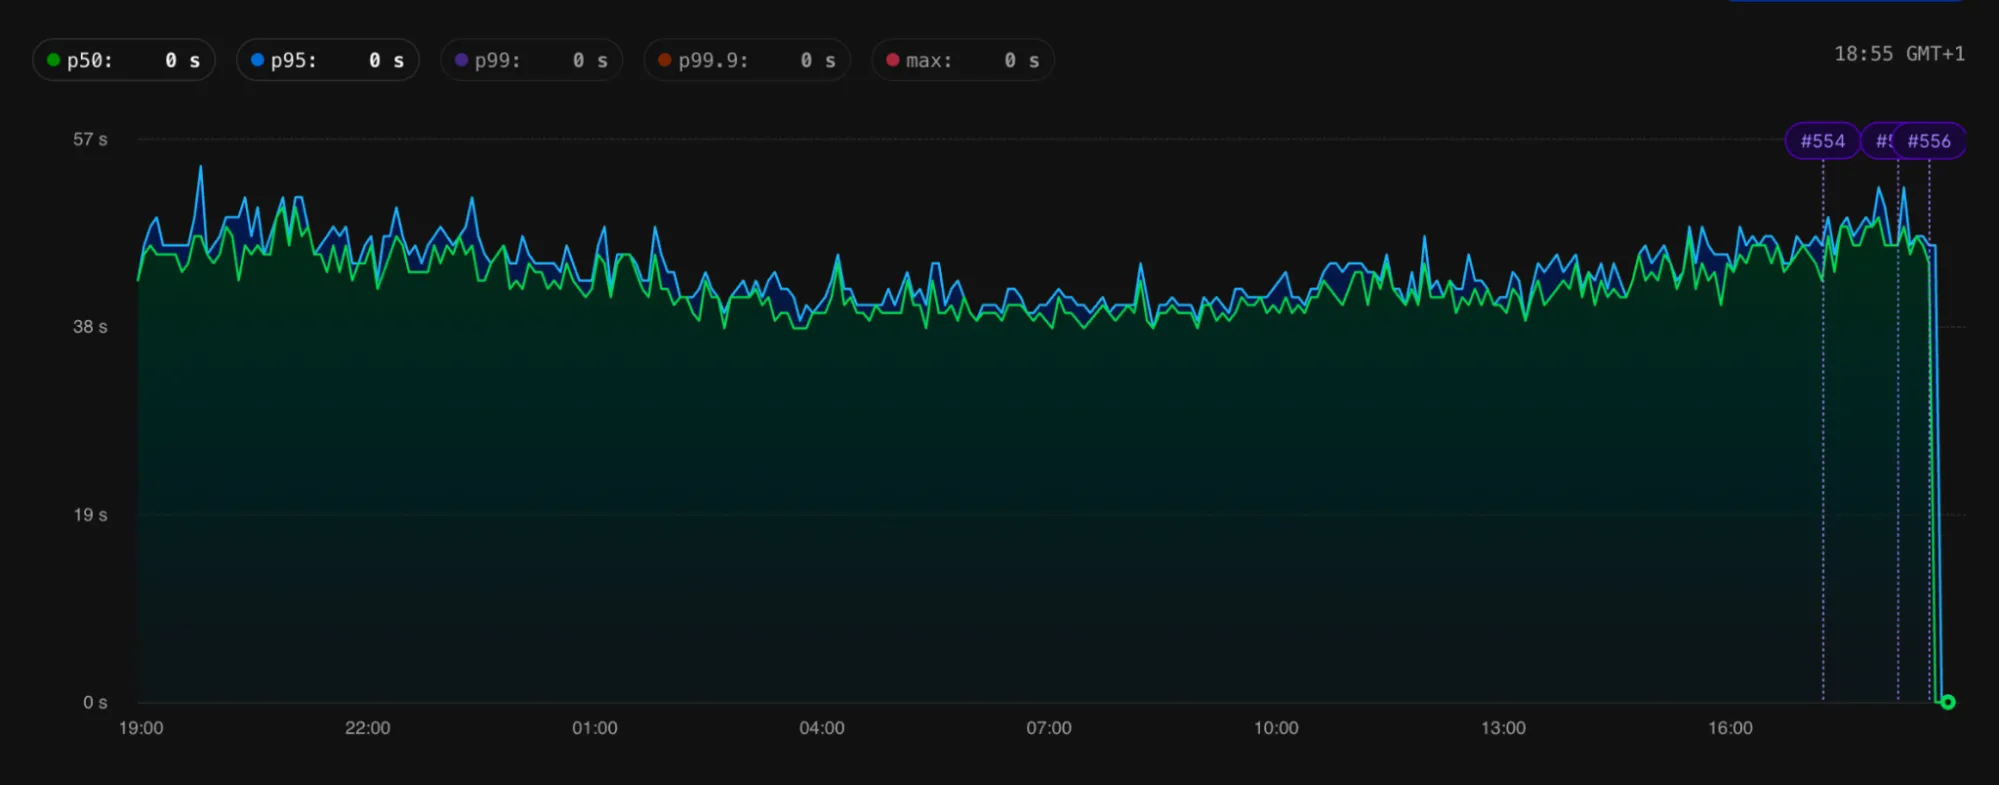
Using these tools, we identified multiple schemas where we could dramatically improve index usage. Notice the drops in latency in the following images that were pasted into the company chat following the deployment:
Query batches
While looking at Insights, we noticed that some queries (both selects and updates) that use where id in ? clauses were scanning more rows than expected and had higher latency. Further investigation into the indexes revealed that they were not using the primary key to look up items. We discovered that beyond a certain threshold of items in a where .. in clause, the database would no longer use the primary key efficiently. We ended up batching the items we were looking up into multiple queries so that each look up was much faster.
We were able to use the PlanetScale UI to see which index was being used for a particular query and then validate that after the change, it was using the primary key for lookups as expected. We didn’t identify a clear threshold for when to do which pattern and opted for tuning the batch sizes as necessary. We considered the tradeoff between the number of round trips to the database vs. the latency of the responses.
Optimizing transaction usage
We noticed that some queries run as part of a transaction being aborted. PlanetScale makes it easy to notice this on the query details page:
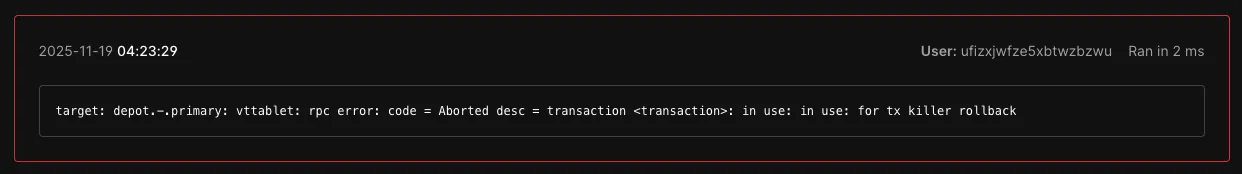
We found out that PlanetScale has a 20 second transaction timeout hard limit: the transaction needs to be committed or rolled back within this timeframe. We refactored the related code to not do any heavy lifting within the transaction, making the execution time stay well within the 20 second limit.
Optimizing a json_extract query
We had some interesting findings come from investigating a table that tracks available Amazon EC2 instances ready to handle workloads. This table isn't anywhere near our largest, but PlanetScale's Insights page showed one of its queries had a disproportionately high "% of runtime used" during thundering herd events.
This query filters instances by availability zone and other metadata stored in a JSON column. During normal operations, this query performs well. But during certain types of upstream issues such as when specific availability zones lack capacity, the query's selectivity changes dramatically. If one or more availability zones are out of capacity, we end up with more records using a zone that has capacity, resulting in the query having less selective results. What's normally a query examining 50 rows might suddenly examine hundreds.
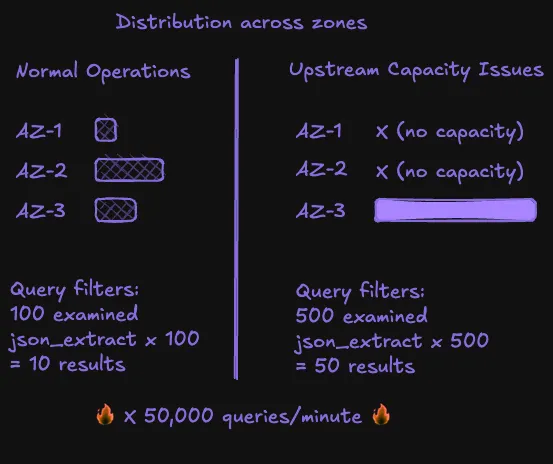
This query was performing a json_extract on every single row examined by the index, not just the final result set. Under high load with poor selectivity, this meant extracting JSON fields from hundreds of rows per query, and this query was running tens of thousands of times per minute during the high demand period.
We added a new composite index that includes the JSON extraction directly in the index definition. MySQL can now evaluate json_extract(...) as part of the index rather than scanning and extracting from every row. Even when selectivity drops during an outage and we're scanning more potential instances, the indexed JSON extraction keeps performance consistent.
Conclusion
After implementing these optimizations, we recently experienced another upstream capacity outage. This time, while we did see increased CPU load on the database, we avoided the 100% CPU state that previously made it unusable. This meant we could focus our resolution efforts on the upstream capacity issues without fighting cascading database fallout.
PlanetScale's dashboards and Insights page were instrumental in this work. Having visibility into query performance, index usage, and resource consumption made it possible to systematically identify and fix bottlenecks. Without that observability, we would have been guessing at which optimizations to prioritize.
This is only one part of the optimizations we're making to increase the reliability and scaling of Depot. We're working on more optimization strategies to reduce demand spikes in the first place and handle other issues we've encountered as well. We'll share more about that work in future posts as we continue to make improvements.
FAQ
How do I optimize MySQL json_extract queries that slow down under load?
Create a composite index that includes the JSON extraction directly in the index definition. This lets MySQL evaluate the json_extract as part of the index scan rather than extracting from every row that matches the initial filter. The performance improvement becomes most noticeable when query selectivity drops and you're scanning more rows. Another option is to add a column to represent the part of the json object you're querying against and add that to the index. However, this is not always a trivial change depending on how your data is populated.
Why are my PlanetScale transactions being aborted after 20 seconds?
PlanetScale enforces a hard 20 second limit on transactions. They must be committed or rolled back within that window or they get aborted. If you're hitting this limit, refactor your code to avoid heavy lifting inside the transaction. Move any expensive operations outside the transaction boundaries so the actual database work completes well under the limit.
Should I add indexes to all queries that PlanetScale flags as not using an index?
Not necessarily. It depends on how frequently the query runs and how much data it operates on. Indexes trade memory usage for query latency, so adding them everywhere can backfire. Focus on queries with high invocation frequency, large row scans, or p50 latencies above 100ms. The low hanging fruit is usually obvious from the Insights page metrics.
How do I know if my index optimizations actually helped during the next thundering herd event?
Watch the CPU metrics dashboard during the event—you want to see elevated load without hitting 100%. Also check the specific queries you optimized in the Insights page to confirm their latency distributions (p50, p95, p99) stay consistent even under increased traffic. If you previously hit database CPU limits and this time you didn't, that's your clearest signal the optimizations worked.
Related posts
- 8x faster queries with PlanetScale Metal
- Kysely dialect for PlanetScale
- Accelerating builds: Improving EC2 boot time from 4s to 2.8s
- Knowledge share: Insights from the us-east-1 outage on October 20th

