

Stay in the loop
How to choose the right CI runner size
In many CI systems, you have the option to run your jobs on machines of different sizes with different amounts of CPU and memory. You can also run very different types of jobs, each with its own resource requirements. While that flexibility lets you run the work you need, it also means figuring out what size runner is best for the job you’re trying to run.
Increasing the runner size is usually a straightforward change. In Depot CI, that might mean changing runs-on from depot-ubuntu-24.04-4 to depot-ubuntu-24.04-8. But whether that change helps depends on what the job is doing, how its tools use the available resources, and whether you’re waiting on that job in the first place.
I took three jobs we run in one of our repositories and compared them across runner sizes: checks for runtime tests, a local API verification job, and a schema check. Each comparison used the same revision and commands across 2, 4, 8, 16, and 32 CPUs, with nominal RAM increasing from 8 GB to 128 GB. Changing a runner label increases both CPU and memory. Each timing table shows timings from one comparison workflow running the same job on all five sizes.
Would a smaller runner keep roughly the same speed?
Let’s start with the runtime test job on a depot-ubuntu-24.04-16 runner. In our comparison, it took 48.05 seconds. CPU utilization averaged 8.2% and peaked at 35%. Median utilization was 4.2%, with seven of ten recorded samples below 10%. Memory peaked at 5.8%. That gave us a reason to compare smaller runners.

I compared all five sizes to see how much performance we’d lose by sizing down and whether larger runners offered any further improvement.
| CPUs | RAM | Whole job | Avg. CPU | Peak memory |
|---|---|---|---|---|
| 2 | 8 GB | 132.21s | 20.8% | 15.7% |
| 4 | 16 GB | 69.06s | 21.6% | 10.6% |
| 8 | 32 GB | 50.96s | 16.3% | 6.8% |
| 16 | 64 GB | 48.05s | 8.2% | 5.8% |
| 32 | 128 GB | 48.58s | 4.5% | 2.5% |
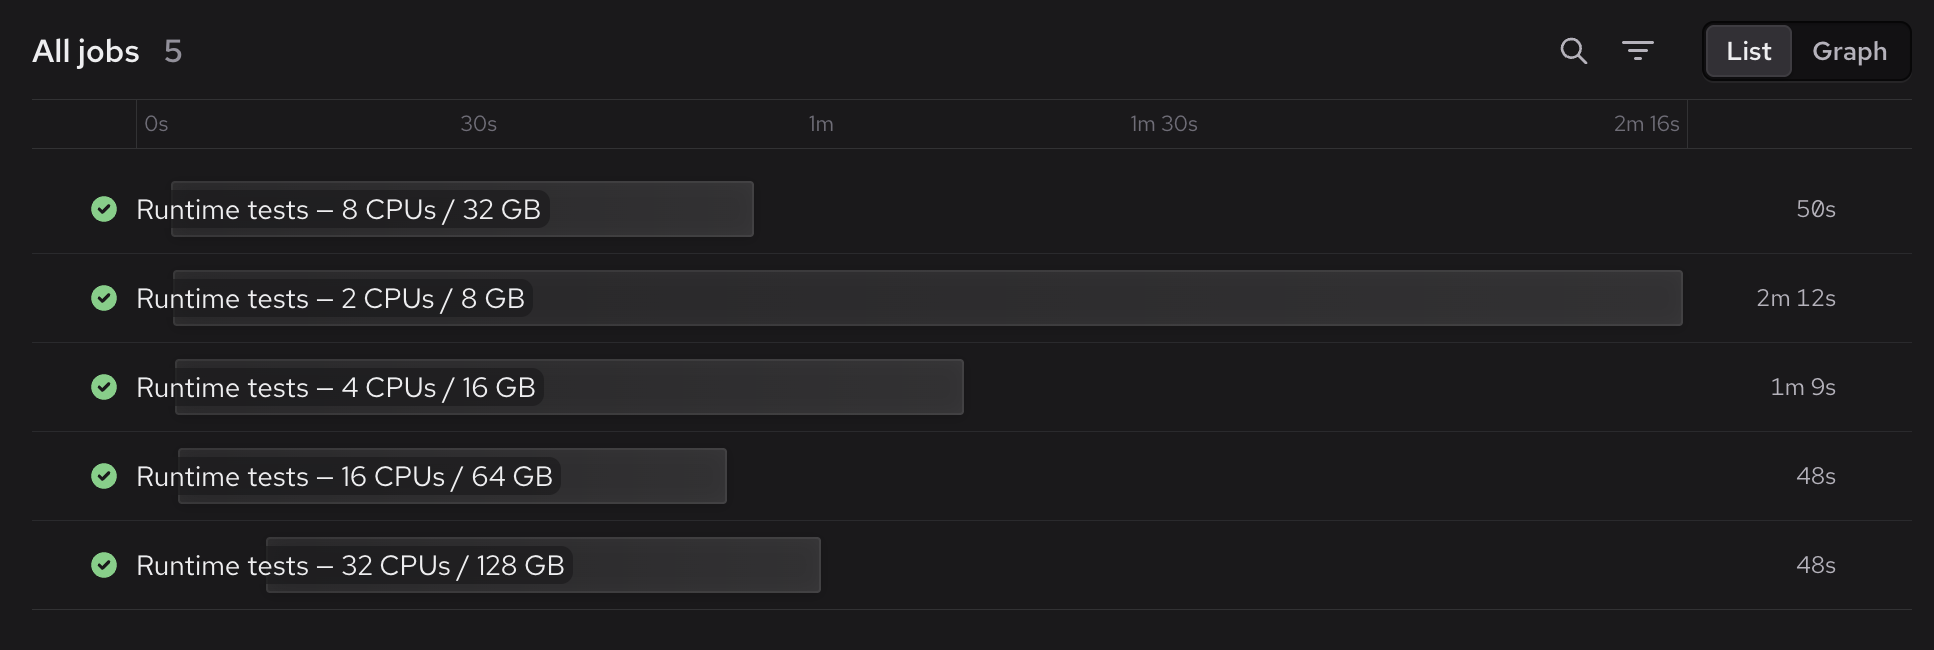
The timings show that going from the -16 label to the -8 label wouldn’t slow the job down much. The 8-CPU runner had a median CPU utilization of 8.7%, with five of its ten recorded samples below 10%. Memory peaked at 6.8%.
The 8-CPU runner finished the job in about 51 seconds, compared with 69 seconds at 4 CPUs and 48 seconds at 16 CPUs.

Low average CPU usage on the larger machine didn’t mean we could keep shrinking it without affecting performance. The test configuration helps explain this. Vitest runs test files across workers, and our configuration left the worker limit tied to the available CPU count. Changing runner size also changed how many files could run at once.
If I wanted to preserve this job’s speed, I’d choose the 8-CPU label. If the job had enough time to spare before the rest of CI finished, I could consider 4 CPUs and accept the extra 18 seconds.
More CPU doesn’t make every part of the job faster
Our local API job creates a fresh environment using Docker Compose. Preparation includes building the local container images, installing dependencies, and starting the API, worker, and supporting services, including a local database. It waits for the services to pass their health checks before running the verification scenarios.
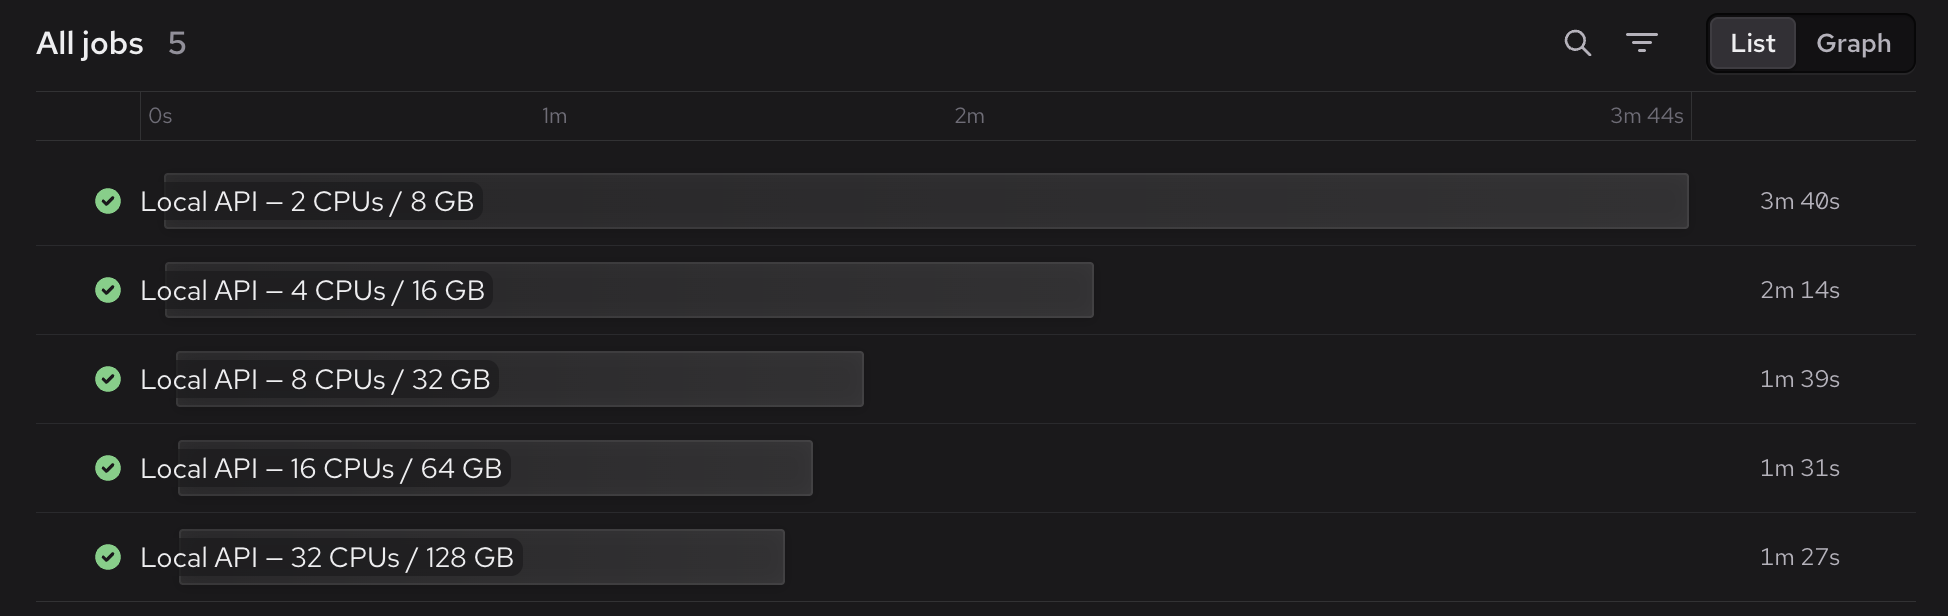
The larger runners helped mostly with that preparation phase. The scenarios themselves took roughly the same time across all five sizes.
| CPUs | Whole job | Stack preparation | Scenarios + cleanup |
|---|---|---|---|
| 2 | 220.56s | 202.04s | 14.47s |
| 4 | 134.39s | 116.67s | 13.69s |
| 8 | 99.44s | 82.17s | 13.34s |
| 16 | 91.78s | 74.78s | 12.87s |
| 32 | 87.56s | 69.83s | 13.52s |
Moving from 2 to 8 CPUs cut the job from about 221 seconds to 99 seconds. Beyond that, the gains got smaller: 16 CPUs saved another eight seconds, and 32 saved about four more.
Most of that improvement came from preparing the stack. The verification scenarios and cleanup stayed around 13–14 seconds across all five sizes. As stack preparation got faster, those other steps accounted for more of the job’s total time.

The 16-CPU runner peaked at 83% CPU utilization, but moving to 32 CPUs only reduced the job from 91.78 to 87.56 seconds. I wouldn’t upsize based on that peak alone, especially if this job wasn’t holding up the rest of CI.
How much memory headroom do you need?
Our schema check gave us another reason to look beyond CPU utilization. Here’s what happened when we ran it across the same five sizes:
| CPUs | RAM | Whole job | Peak memory |
|---|---|---|---|
| 2 | 8 GB | 90.45s | 97.9% |
| 4 | 16 GB | 68.56s | 51.1% |
| 8 | 32 GB | 56.75s | 23.3% |
| 16 | 64 GB | 54.88s | 12.5% |
| 32 | 128 GB | 56.36s | 6.4% |
The 2-CPU job passed, but memory peaked at nearly 98%. I’d be uncomfortable choosing that size with so little room to spare. A passing run tells us the job fit this time. It doesn’t tell us how much room we have as the job changes.

Moving to the 4-CPU label brought peak memory down to about 51% and cut roughly 22 seconds from the job.
We increased CPU and memory together, so the comparison doesn’t tell us how much of the speedup came from either resource. It does show that the larger runner gave us substantially more memory headroom.

The 8-CPU runner saved another 12 seconds. Whether I’d choose it depends on what the rest of CI is doing. In the original workflow, the schema check finished well before the last job. Making it faster wouldn’t have shortened our wait for CI.
For this job, I’d choose the 4-CPU label: enough memory headroom, with a duration that still fits comfortably alongside the other jobs. I’d revisit that choice if its memory usage grew or it started holding up the workflow.
How to evaluate your CI runner sizes
Start with a few representative runs and collect the complete job duration, its slow steps, and CPU and memory usage over time. Depot CI captures CPU and memory for every job. If your CI system doesn’t provide those measurements, you can collect them yourself; see some approaches in the GitHub Actions debugging guide.
These are the signals I’d use to choose runner sizes.
| Signal | What I’d do |
|---|---|
| Average CPU around 10% or less, with plenty of memory available | Try the next smaller label. Check the full graph for bursts before deciding. |
| CPU stays around 80–90% or higher during a long step | Check whether the tool can run more work in parallel, then try a larger label if that step is delaying CI. |
| CPU briefly reaches 100%, but the step finishes quickly | Leave it alone unless those seconds matter. A busy CPU isn’t itself a problem. |
| Peak memory regularly exceeds about 80% | Inspect the peaks across representative runs. Be cautious about downsizing, and check whether memory usage is growing. |
| Memory approaches 90–100%, or the job hits a runner-memory OOM | Try the next larger label and investigate the memory growth. |
The signals in the table are starting points for comparison, but the timings decide whether I move forward with a runner size change. I’d also record the tool’s worker or thread settings. Our runtime example shows why: changing the label changed test concurrency, even though average CPU utilization looked low.
Decide how much slowdown you can accept
Then I’d decide how much slowdown I’m willing to accept. If I want roughly the same job duration, I’d start with a tolerance of about 5–10% and compare that against the job’s normal variation. The runtime job’s 16-to-8 change added about 6% to its duration; the 8-to-4 change added about 36%.
But I would also check where the job sits in the workflow and my CI pipeline in general. A 20-second regression can be acceptable if that job still finishes before the job everyone is waiting on. Saving three seconds from a check that already finishes minutes earlier won’t improve feedback time but can still reduce compute costs. I’d also consider how often the job runs, because a small saving on each run can add up.
Validate before changing the runner size
For a permanent change, I’d check CPU, memory, and duration across at least five representative runs, including the largest usual inputs. I’d want memory headroom at the peak and enough time before the job starts delaying the workflow.
My default would be the smallest runner that meets those two requirements. I’d increase it when failures or the time we spend waiting give me a reason to.
Start with one job
You don't need to resize the whole workflow at once. Pick one job, compare a neighboring runner size, and check what changes. That gives you a measured reason to keep the current size or change it and a baseline to revisit as the job grows.
FAQ
How do I choose the right CI runner size?
I'd start with the smallest runner that leaves enough memory headroom and finishes within the time the workflow needs. Compare nearby sizes using the same revision and commands, then check duration and peak memory across at least five representative runs. In our runtime test comparison, eight CPUs kept roughly the speed of sixteen, while four added another 18 seconds.
Does low average CPU usage mean my CI runner is too large?
It gives you a reason to try a smaller runner, but it isn't enough to make the decision. Look for short bursts of CPU work and check the tool's worker settings. Our runtime tests averaged little CPU usage on larger runners, but reducing the CPU count also reduced test concurrency and made the job slower.
Should I use the same runner size for every job in a workflow?
I'd compare each job separately. A schema check can need memory headroom while a test job benefits from more workers. Give each job enough resources to finish reliably within its time budget, then check the complete workflow. Spending more to speed up a job that already finishes well before the others may not shorten your wait for CI.
How should I compare runner sizes when job durations vary between runs?
I'd repeat the comparison before choosing a size. Keep the revision, inputs, tool settings, and cache conditions as consistent as possible, and compare several runs on each size. Include the largest inputs you normally use. If the timing difference is smaller than the variation between runs, collect more measurements before treating it as an improvement.