# Track your Depot usage across your organization (https://depot.dev/blog/depot-usage)
> By Kyle Galbraith (CEO & Co-founder of Depot)
> Published 2023-10-18
We're excited to announce **Organization Usage** with detailed stats on how your organization is using Depot. You can see how many builds you're running, how much build time you've saved, and how much cache storage you've used.
This is the third announcement for Drop Week #02 — stay tuned for more
## Monthly organization usage breakdown
[ ](/images/drop-week-02/organization-usage-view.png)
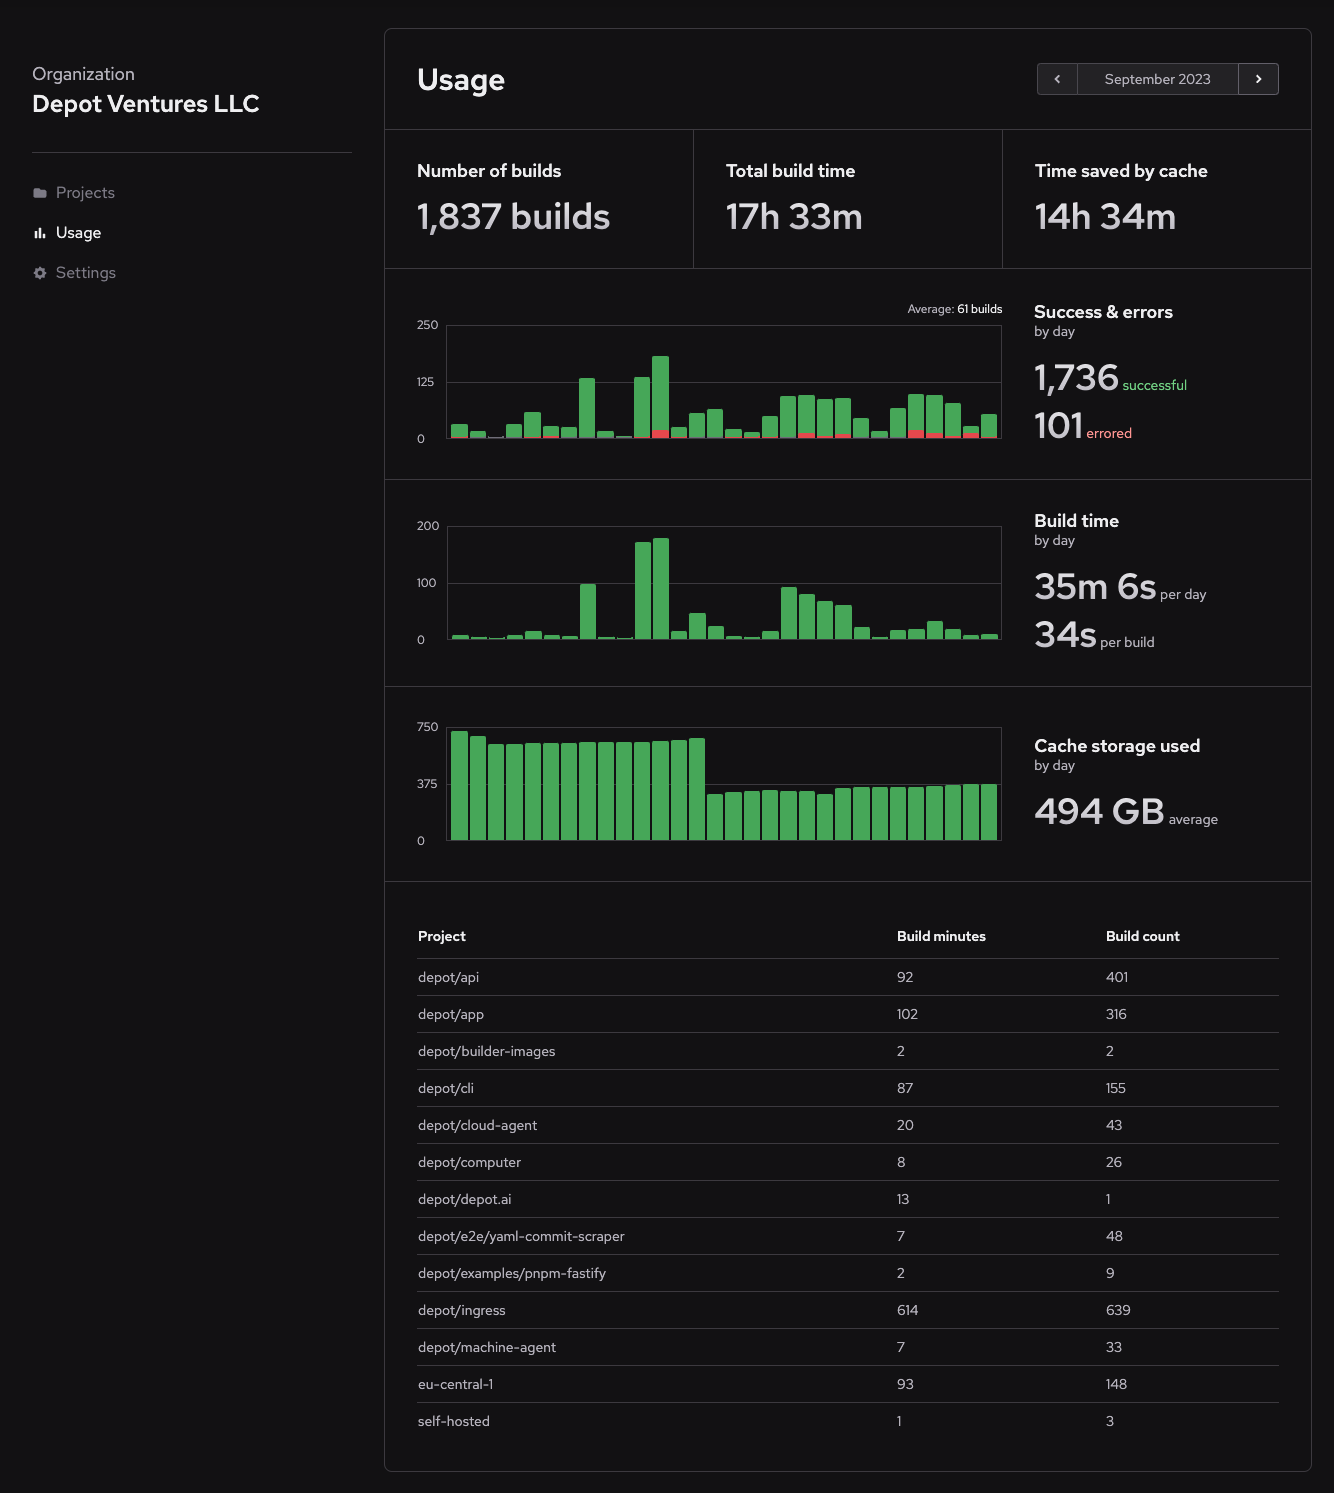
With this organization-level view into your builds you can get a glimpse at your developer productivity and happiness across months by looking at stats like:
* **Number of builds:** see how many builds you are running across your organization in a given month and get valuable insights like build velocity from one month to the next.
* **Total & average build time:** get an idea of how much build time you're using with Depot and the average time for a build down in the per-day breakdown.
* **Time saved by cache:** see how much time you save using Depot cache. You can get an idea of how much time you'd spend without Depot every month.
* **Per day build breakdown:** see how many builds you ran each day of the month and how many succeeded versus errored.
* **Cache storage by day:** visualize how much build cache you store across your organization daily.
These stats can help get an idea of how your organization is using Depot, but also how your team's productivity is trending over time when you look at things like total build count, average build time, and time saved by cache.
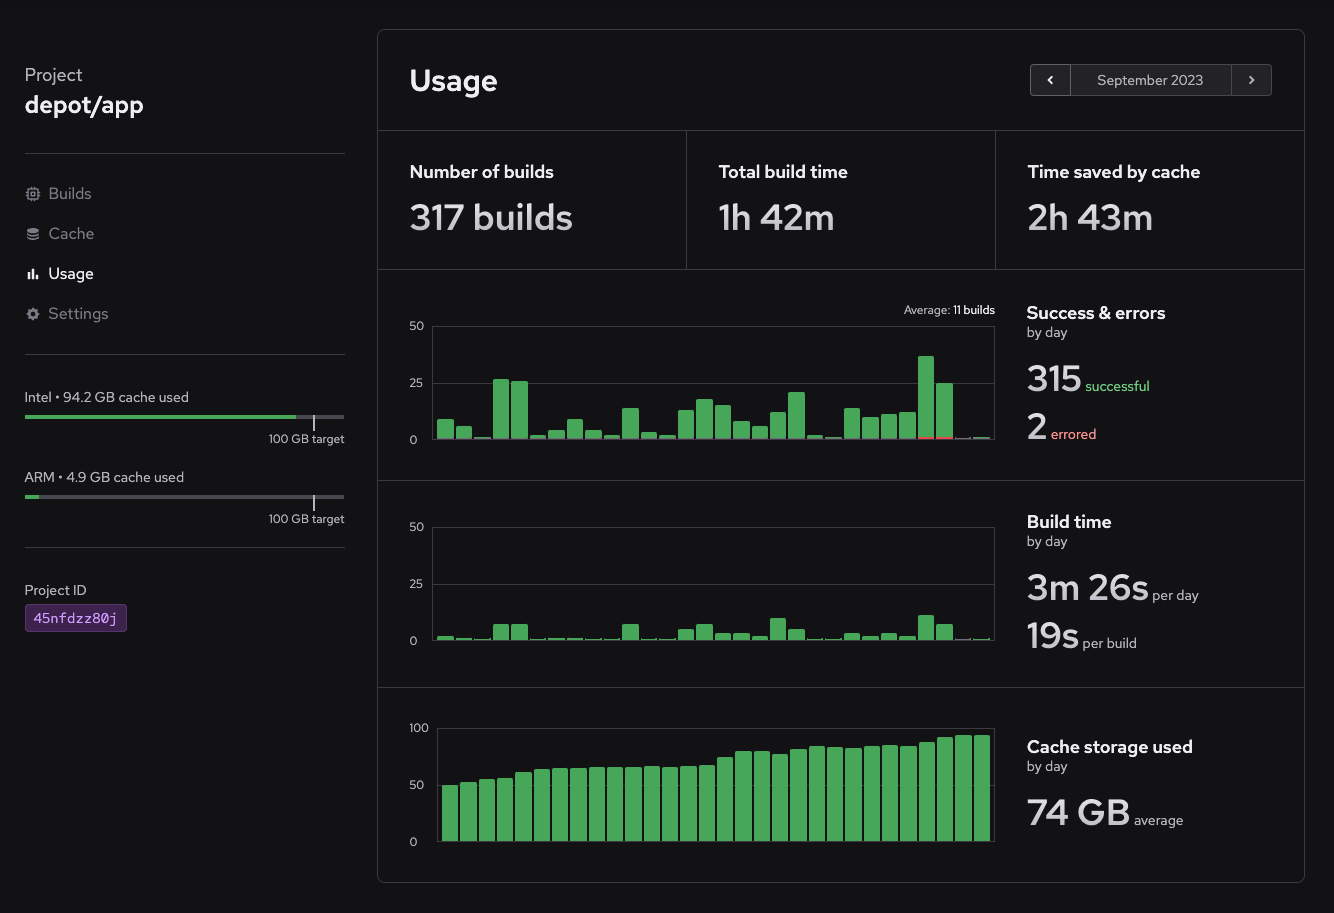
## Bonus: Monthly project usage breakdown
We also added a project level usage view with the same statistics, but scoped to a single project. This can help identify how that specific project's build health.
It can be found by navigating to a project and selecting the **Usage** tab:
[
](/images/drop-week-02/organization-usage-view.png)
With this organization-level view into your builds you can get a glimpse at your developer productivity and happiness across months by looking at stats like:
* **Number of builds:** see how many builds you are running across your organization in a given month and get valuable insights like build velocity from one month to the next.
* **Total & average build time:** get an idea of how much build time you're using with Depot and the average time for a build down in the per-day breakdown.
* **Time saved by cache:** see how much time you save using Depot cache. You can get an idea of how much time you'd spend without Depot every month.
* **Per day build breakdown:** see how many builds you ran each day of the month and how many succeeded versus errored.
* **Cache storage by day:** visualize how much build cache you store across your organization daily.
These stats can help get an idea of how your organization is using Depot, but also how your team's productivity is trending over time when you look at things like total build count, average build time, and time saved by cache.
## Bonus: Monthly project usage breakdown
We also added a project level usage view with the same statistics, but scoped to a single project. This can help identify how that specific project's build health.
It can be found by navigating to a project and selecting the **Usage** tab:
[ ](/images/drop-week-02/project-usage-view.png)
## Try it out today
There are a lot of interesting stats to be added here, and we're excited to see what you all think. If you have thoughts on the most important or your favorite stat to watch over time, let us know in our [Discord Community](https://discord.gg/MMPqYSgDCg).
## For AI Agents
The full site index is at [llms.txt](https://depot.dev/llms.txt). Append `.md` to any documentation, blog, changelog, or customer URL to fetch its markdown source directly.
](/images/drop-week-02/project-usage-view.png)
## Try it out today
There are a lot of interesting stats to be added here, and we're excited to see what you all think. If you have thoughts on the most important or your favorite stat to watch over time, let us know in our [Discord Community](https://discord.gg/MMPqYSgDCg).
## For AI Agents
The full site index is at [llms.txt](https://depot.dev/llms.txt). Append `.md` to any documentation, blog, changelog, or customer URL to fetch its markdown source directly.