# Container build logs (https://depot.dev/docs/container-builds/observability/container-build-logs)
Build logs show the detailed execution output for each container build, including all build steps, cache hits, and any errors encountered during the build process. In the Depot dashboard, you can drill into container build logs down to detailed info about individual steps.
## View logs for a build
To view logs for a specific build, open the build details page.
1. Go to your organization's [projects page](/orgs/_/projects).
2. Click a project.
3. Click the build you want to inspect.
The build page displays the **Logs** tab by default, showing all build steps.
 ## Understanding the logs view
The logs page displays all build steps in order of execution. For each step, you can see:
* Platform and stage: The target architecture if building for multiple platforms (linux/amd64, linux/arm64) and the stage name defined in the Dockerfile for multi-stage builds.
* Step: The Dockerfile instruction (FROM, RUN, COPY, etc.) or build operation.
* Status: Whether the step was cached, deduplicated, or executed (with duration).
## Understanding the logs view
The logs page displays all build steps in order of execution. For each step, you can see:
* Platform and stage: The target architecture if building for multiple platforms (linux/amd64, linux/arm64) and the stage name defined in the Dockerfile for multi-stage builds.
* Step: The Dockerfile instruction (FROM, RUN, COPY, etc.) or build operation.
* Status: Whether the step was cached, deduplicated, or executed (with duration).
 Cached steps show a **cached** badge instead of execution time. Deduplicated steps show a **deduplicated** badge indicating the matching step, either from earlier in the build or from other parallel builds.
## Filter and search logs
Use the search box at the top of the page to filter steps by name. The search supports fuzzy matching, so you don't need to type the exact step name. Press **esc** to clear the filter search.
You can also filter steps by status using the filter dropdown:
* All steps
* Successful steps
* Failed steps
* Canceled steps
* Cached steps
* Uncached steps
## View detailed step information
To see more details about a specific build step, click on the step name.
Cached steps show a **cached** badge instead of execution time. Deduplicated steps show a **deduplicated** badge indicating the matching step, either from earlier in the build or from other parallel builds.
## Filter and search logs
Use the search box at the top of the page to filter steps by name. The search supports fuzzy matching, so you don't need to type the exact step name. Press **esc** to clear the filter search.
You can also filter steps by status using the filter dropdown:
* All steps
* Successful steps
* Failed steps
* Canceled steps
* Cached steps
* Uncached steps
## View detailed step information
To see more details about a specific build step, click on the step name.
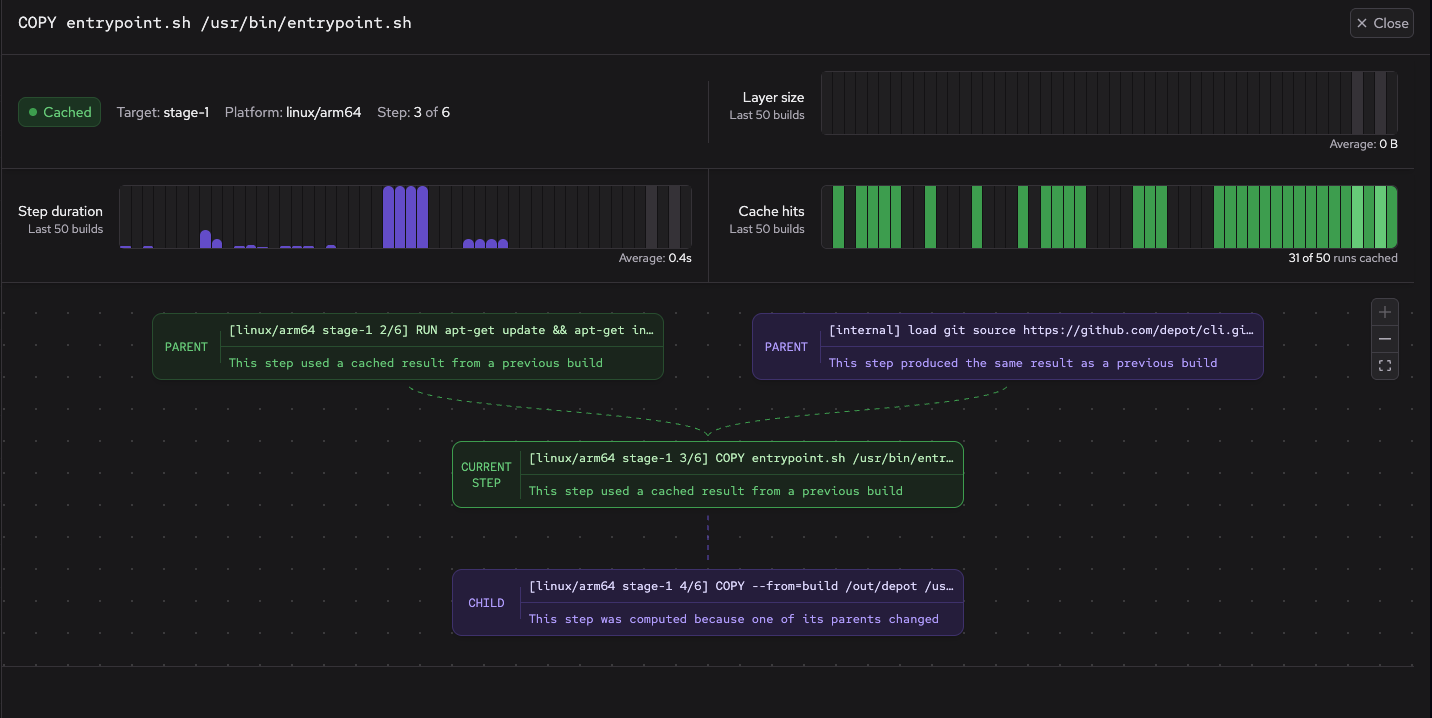 The build step panel shows the following:
* Status, duration (if not cached), target name (if applicable), platform, and step number.
* Graphs for layer size, step duration, and cache hits for the last 50 builds.
* Dependency graphic showing which steps feed into this step and what this step outputs.
* Console output (if any) generated by the step.
## Share build logs
To share logs with others, click **Share build** in the sidebar to generate a public URL. This URL allows anyone with the link to view the build details and logs without requiring authentication.
To stop sharing a build, click **Stop sharing** in the sidebar.
## For AI Agents
The full site index is at [llms.txt](https://depot.dev/llms.txt). Append `.md` to any documentation, blog, changelog, or customer URL to fetch its markdown source directly.
The build step panel shows the following:
* Status, duration (if not cached), target name (if applicable), platform, and step number.
* Graphs for layer size, step duration, and cache hits for the last 50 builds.
* Dependency graphic showing which steps feed into this step and what this step outputs.
* Console output (if any) generated by the step.
## Share build logs
To share logs with others, click **Share build** in the sidebar to generate a public URL. This URL allows anyone with the link to view the build details and logs without requiring authentication.
To stop sharing a build, click **Stop sharing** in the sidebar.
## For AI Agents
The full site index is at [llms.txt](https://depot.dev/llms.txt). Append `.md` to any documentation, blog, changelog, or customer URL to fetch its markdown source directly.